
Videos
Sales territory and salesperson profitability analysis
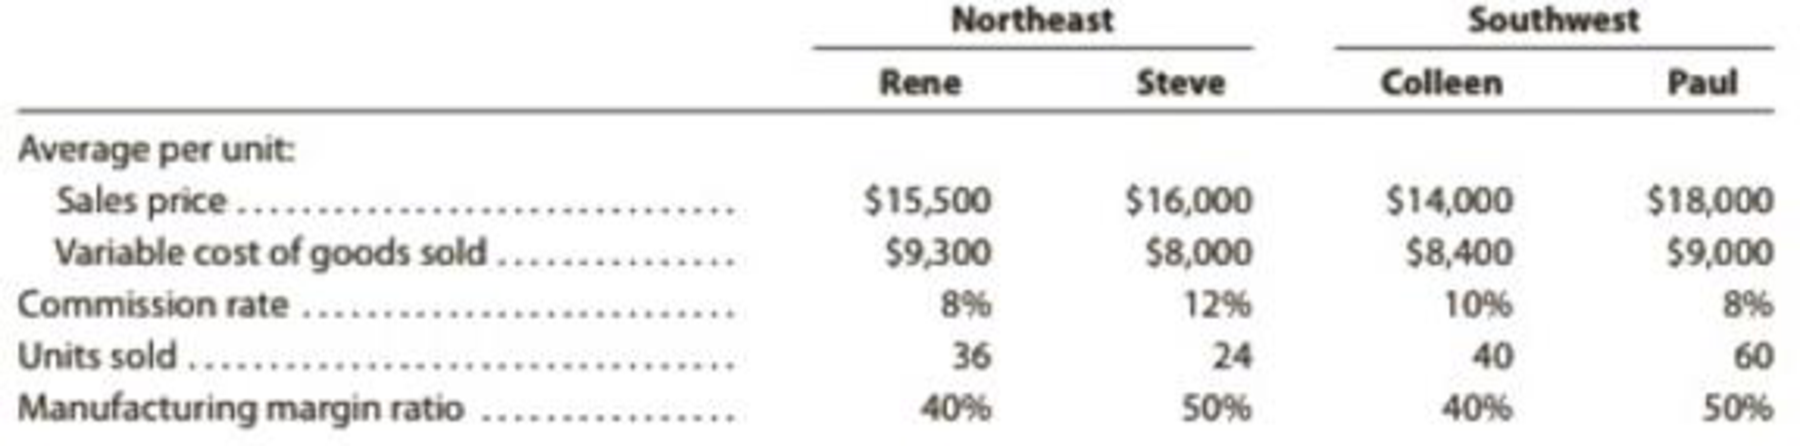
Havasu Off-Road Inc. manufactures and sells a variety of commercial vehicles in the Northeast and Southwest regions. There are two salespersons assigned to each territory. Higher commission rates go to the most experienced salespersons. The following sales statistics are available for each salesperson:
- a. 1. Prepare a contribution margin by salesperson report. Compute the contribution margin ratio for each salesperson.
2. Interpret the report.
- b. 1. Prepare a contribution margin by territory report. Compute the contribution margin for each territory as a percent, rounded to one decimal place.
2. Interpret the report.
A.1.
Calculate the contribution margin ratio for each salesperson.
Explanation of Solution
Variable Costing
Managers frequently use variable costing for internal purposes for taking decision making. The cost of goods manufactured includes direct materials, direct labor, and variable factory overhead. Fixed factory overhead treated as period (fixed) expense.
Contribution Margin
Contribution margin is the excess of manufacturing margin above selling and administrative expenses. Contribution margin is calculated by deducting the variable cost from sales or deducting variable selling and administrative expenses from manufacturing margin.
The contribution margin ratio for each salesperson is as follows:
Rene
| HO Incorporation | |
| Contribution margin by salesperson (Northeast) | |
| Particulars | Rene ($) |
| Sales | 558,000 |
| Less: Variable cost | 334,800 |
| Manufacturing margin | 223,200 |
| Less: Variable selling expense | 44,640 |
| Contribution margin (B) | 178,560 |
| Contribution margin ratio | 32.00% |
Table (1)
Steve
| HO Incorporation | |
| Contribution margin by salesperson (Northeast) | |
| Particulars | Steve($) |
| Sales | 384,000 |
| Less: Variable cost | 192,000 |
| Manufacturing margin | 192,000 |
| Less: Variable selling expense | 46,080 |
| Contribution margin (B) | 145,920 |
| Contribution margin ratio | 38.00% |
Table (2)
Colleen
| HO Incorporation | |
| Contribution margin by salesperson (Southwest) | |
| Particulars | Colleen($) |
| Sales | 560,000 |
| Less: Variable cost | 336,000 |
| Manufacturing margin | 224,000 |
| Less: Variable selling expense | 56,000 |
| Contribution margin (B) | 168,000 |
| Contribution margin ratio | 30.00% |
Table (3)
Paul
| HO Incorporation | |
| Contribution margin by salesperson (Southwest) | |
| Particulars | Paul($) |
| Sales | 1,080,000 |
| Less: Variable cost | 540,000 |
| Manufacturing margin | 540,000 |
| Less: Variable selling expense | 86,400 |
| Contribution margin (B) | 453,600 |
| Contribution margin ratio | 42.00% |
Table (4)
Therefore, contribution margin of Rene is $178,560, Steve is $145,920, Colleen is $168,000, and Paul is $453,600. Contribution margin ratio of Rene is 32%, Steve is 38%, Colleen is 30%, and Paul is 42%.
A.2.
Interpret the profitability report of the salesperson.
Explanation of Solution
Contribution margin and contribution margin ratio of salesperson Paul is higher than the other three salespeople because he sells the more units than others, has a low commission rate, and product mix with high manufacturing margin ratio. Salesperson Rene has a second-highest total contribution margin of $178,560, and Steve has second highest contribution margin ratio of 38%.
B.1.
Calculate the contribution margin ratio for each territory.
Explanation of Solution
The contribution margin ratio for each territory is as follows:
Northeast
| HO Incorporation | |
| Contribution margin by territory | |
| Particulars | Northeast |
| Sales | 942,000 |
| Less: Variable cost | 526,800 |
| Manufacturing margin | 415,200 |
| Less: Variable selling expense | 90,720 |
| Contribution margin (B) | 324,480 |
| Contribution margin ratio | 34.45% |
Table (5)
Southwest
| HO Incorporation | |
| Contribution margin by territory | |
| Particulars | Southwest |
| Sales | 1,640,000 |
| Less: Variable cost | 876,000 |
| Manufacturing margin | 764,000 |
| Less: Variable selling expense | 142,400 |
| Contribution margin (B) | 621,600 |
| Contribution margin ratio | 37.90% |
Table (6)
B. 2.
State the advice regarding the relative profitability of two territories.
Explanation of Solution
The southwest region contribution margin and contribution margin ratio are higher than the northeast region because the southwest region has $698,000 more sales and $297,120 more contribution margin. In addition, the salesperson in the southwest region has the highest unit sold, highest sales price and lowest commission margin. In the northeast region, salespersons are performed very poor than others, and they are trying to improve their sales performance.
Want to see more full solutions like this?
Chapter 7 Solutions
Managerial Accounting


- Evaluating selling and administrative cost allocations Gordon Gecco Furniture Company has two major product lines with the following characteristics: Commercial office furniture: Few large orders, little advertising support, shipments in full truckloads, and low handling complexity Home office furniture: Many small orders, large advertising support, shipments in partial truckloads, and high handling complexity The company produced the following profitability report for management: The selling and administrative expenses are allocated to the products on the basis of relative sales dollars. Evaluate the accuracy of this report and recommend an alternative approach.arrow_forwardSalespersons report and analysis Pachec Inc. employs seven salespersons to sell and distribute its product throughout the state. Data taken from reports received from the salespersons during the year ended June 30 are as follows: Instructions 1. Prepare a table indicating contribution margin, variable cost of goods sold as a percent of sales, variable selling expenses as a percent of sales, and contribution margin ratio by salesperson. 2. Which salesperson generated the highest contribution margin ratio for the year and why? 3. Briefly list factors other than contribution margin that should be considered in evaluating the performance of salespersons.arrow_forwardTerritory and Product Profitability Analysis Coast to Coast Surfboards Inc. manufactures and sells two styles of surfboards, Atlantic Wave and Pacific Pounder. These surfboards are sold in two regions, East Coast and West Coast. Information about the two surfboards is as follows: Atlantic Wave Pacific Pounder Sales price $200 $120 Variable cost of goods sold per unit (150) (90) Manufacturing margin per unit $50 $30 Variable selling expense per unit (34) (16) Contribution margin per unit $16 $14 The sales unit volume for the sales territories and products for the period is as follows: East Coast West Coast Atlantic Wave 40,000 25,000 Pacific Pounder 0 25,000 a. Prepare a contribution margin by sales territory report. Compute the contribution margin ratio for each territory as a whole percent, rounded to two decimal places, if required. Coast to Coast Surfboards Inc.Contribution Margin by Territory East Coast West…arrow_forward
- erritory and Product Profitability Analysis Coast to Coast Surfboards Inc. manufactures and sells two styles of surfboards, Atlantic Wave and Pacific Pounder. These surfboards are sold in two regions, East Coast and West Coast. Information about the two surfboards is as follows: Atlantic Wave Pacific Pounder Sales price $400 $350 Variable cost of goods sold per unit (148) (161) Manufacturing margin per unit $252 $189 Variable selling expense per unit (156) (91) Contribution margin per unit $96 $98 The sales unit volume for the territories and products for the period is as follows: East Coast West Coast Atlantic Wave 3,260 1,630 Pacific Pounder 0 1,630 Question Content Area a. Prepare a contribution margin by sales territory report. Compute the contribution margin ratio for each territory as a whole percent, rounded to two decimal places, if required. Coast to Coast Surfboards Inc.Contribution Margin by…arrow_forwardTerritory and Product Profitability Analysis Coast to Coast Surfboards Inc. manufactures and sells two styles of surfboards, Atlantic Wave and Pacific Pounder. These surfboards are sold in two regions, East Coast and West Coast. Information about the two surfboards is as follows: Atlantic Wave Pacific Pounder Sales price $400 $300 Variable cost of goods sold per unit (148) (147) Manufacturing margin per unit $252 $153 Variable selling expense per unit (180) (75) Contribution margin per unit $72 $78 The sales unit volume for the territories and products for the period is as follows: East Coast West Coast Atlantic Wave 2,840 1,420 Pacific Pounder 0 1,420 Question Content Area a. Prepare a contribution margin by sales territory report. Compute the contribution margin ratio for each territory as a whole percent, rounded to two decimal places, if required. Coast to Coast Surfboards Inc.Contribution Margin by Territory…arrow_forwardTerritory and Product Profitability Analysis Coast to Coast Surfboards Inc. manufactures and sells two styles of surfboards, Atlantic Wave and Pacific Pounder. These surfboards are sold in two regions, East Coast and West Coast. Information about the two surfboards is as follows: Atlantic Wave Pacific Pounder Sales price $350 $300 Variable cost of goods sold per unit (130) (147) Manufacturing margin per unit $220 $153 Variable selling expense per unit (143) (69) Contribution margin per unit $77 $84 The sales unit volume for the territories and products for the period is as follows: East Coast West Coast Atlantic Wave 3,200 1,600 Pacific Pounder 0 1,600 a. Prepare a contribution margin by sales territory report. Compute the contribution margin ratio for each territory as a whole percent, rounded to two decimal places, if required. Coast to Coast Surfboards Inc.Contribution Margin by Territoryarrow_forward
- Territory and Product Profitability Analysis Coast to Coast Surfboards Inc. manufactures and sells two styles of surfboards, Atlantic Wave and Pacific Pounder. These surfboards are sold in two regions, East Coast and West Coast. Information about the two surfboards is as follows: Atlantic Wave Pacific Pounder Sales price $350 $300 Variable cost of goods sold per unit (130) (147) Manufacturing margin per unit $220 $153 Variable selling expense per unit (150) (75) Contribution margin per unit $70 $78 The sales unit volume for the territories and products for the period is as follows: East Coast West Coast Atlantic Wave 2,660 1,330 Pacific Pounder 0 1,330 a. Prepare a contribution margin by sales territory report. Compute the contribution margin ratio for each territory as a whole percent, rounded to two decimal places, if required.arrow_forwardTerritory and Product Profitability Analysis Coast to Coast Surfboards Inc. manufactures and sells two styles of surfboards, Atlantic Wave and Pacific Pounder. These surfboards are sold in two regions, East Coast and West Coast. Information about the two surfboards is as follows: Atlantic Wave Pacific Pounder Sales price $400 $350 Variable cost of goods sold per unit (148) (168) Manufacturing margin per unit $252 $182 Variable selling expense per unit (172) (84) Contribution margin per unit $80 $98 The sales unit volume for the territories and products for the period is as follows: East Coast West Coast Atlantic Wave 3,360 1,680 Pacific Pounder 0 1,680 a. Prepare a contribution margin by sales territory report. Compute the contribution margin ratio for each territory as a whole percent, rounded to two decimal places, if required. Coast to Coast Surfboards Inc. Contribution Margin by Territory East…arrow_forwardActivity-Based Customer-Driven Costs Suppose that Stillwater Designs has two classes of distributors: JITdistributors and non -JIT distributors. The JIT distributor places small,frequent orders, and the non -JIT distributor tends to place larger, less frequent orders. Both types of distributors are buying the same product.Stillwater Designs provides the following information about customer-related activities and costs for the most recent quarter: Required:1. Calculate the total revenues per distributor category, and assignthe customer costs to each distributor type by using revenues asthe allocation base. Selling price for one unit is $150. 2. CONCEPTUAL CONNECTION Calculate the customer cost perdistributor type using activity-based cost assignments. Discuss themerits of offering the non -JIT distributors a $2 price decrease(assume that they are agitating for a price concession). 3. CONCEPTUAL CONNECTION Assume that the JIT distributors are simply imposing the frequent orders on…arrow_forward
- Product profitability analysisPower Train Sports Inc. manufactures and sells two .styles of All Terrain Vehicles(ATVs), the Mountain Monster and Desert Dragon, from a single manufacturing facility.The manufacturing facility operates at 100% of capacity. The following per-unitinformation is available for the two products: In addition, the following sales unit volume information for the period is as follows: A. Prepare a contribution margin by product report. Calculate the contributionmargin ratio for each.B. What advice would you give to the management of Power Train Sports Inc.regarding the relative profitability of the two products?arrow_forwardTerritory and Product Profitability Analysis Coast to Coast Surfboards Inc. manufactures and sells two styles of surfboards, Atlantic Wave and Pacific Pounder. These surfboards are sold in two regions, East Coast and West Coast. Information about the two surfboards is as follows: Atlantic Wave Pacific Pounder Sales price $350 $250 Variable cost of goods sold per unit (130) (115) Manufacturing margin per unit $220 $135 Variable selling expense per unit (157) (70) Contribution margin per unit $63 $65 The sales unit volume for the territories and products for the period is as follows: East Coast West coast Atlantic Wave 2,780 1,390 Pacific Pounder 0 1390arrow_forwardActivity-Based Customer-Driven Costs Suppose that Stillwater Designs has two classes of distributors: JIT distributors and non-JIT distributors. The JIT distributor places small, frequent orders, and the non-JIT distributor tends to place larger, less frequent orders. Both types of distributors are buying the same product. Stillwater Designs provides the following information about customer-related activities and costs for the most recent quarter: JITDistributors Non-JITDistributors Sales orders 1,100 110 Sales calls 70 70 Service calls 350 175 Average order size 750 7,500 Manufacturing cost/unit $125 $125 Customer costs: Processing sales orders $3,330,000 Selling goods 1,120,000 Servicing goods 1,050,000 Total $5,500,000 Required: 1. Calculate the total revenues per distributor category, and assign the customer costs to each distributor type by using revenues as the allocation base. Selling price for one unit is $150. Round…arrow_forward
 Managerial AccountingAccountingISBN:9781337912020Author:Carl Warren, Ph.d. Cma William B. TaylerPublisher:South-Western College Pub
 Financial And Managerial AccountingAccountingISBN:9781337902663Author:WARREN, Carl S.Publisher:Cengage Learning,
 Principles of Accounting Volume 2AccountingISBN:9781947172609Author:OpenStaxPublisher:OpenStax College