
Videos
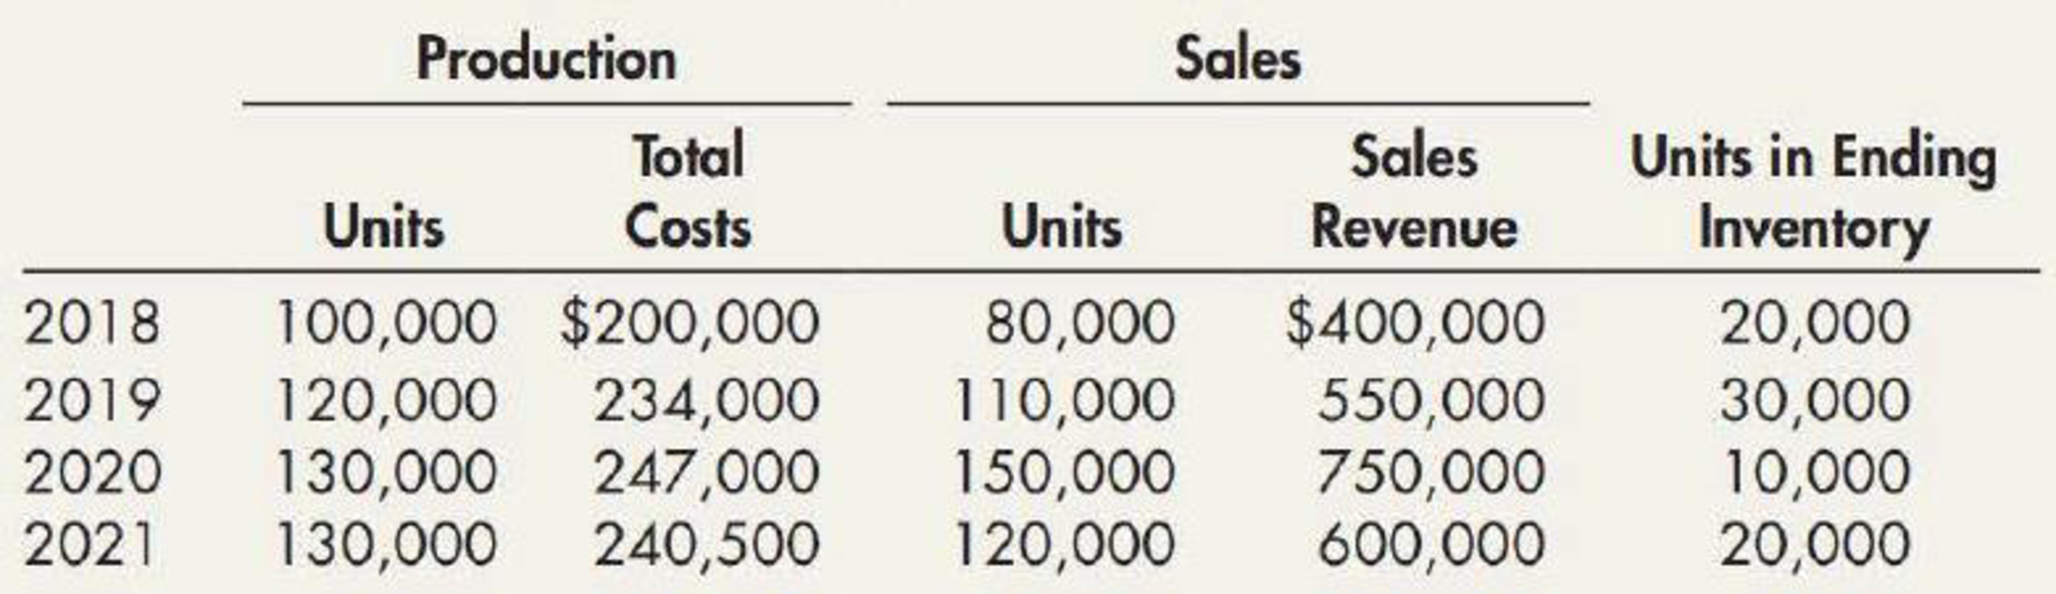
Habicht Company was formed in 2018 to produce a single product. The production and sales for the next 4 years were as follows:
Required:
- 1. Determine the gross profit for each year under each of the following periodic inventory methods:
- a. FIFO
- b. LIFO
- c. Average cost (Round unit costs to 3 decimal places.)
- 2. Next Level Explain whether the company’s return on assets (net income divided by average total assets) would be higher under FIFO or LIFO.
1.
Ascertain the gross profit under the periodic inventory system for each year as per the inventory cashflow methods.
Explanation of Solution
First-in-First-Out (FIFO): In this method, items purchased initially are sold first. So, the value of the ending inventory consists the recent cost for the remaining unsold items.
Last-in-First-Out (LIFO): In this method, items purchased recently are sold first. So, the value of the ending inventory consists the initial cost for the remaining unsold items.
- a) Calculate the gross profit for the four years under FIFO method:
| Particulars | 2018 | 2019 | 2020 | 2021 |
| Amount ($) | Amount ($) | Amount ($) | Amount ($) | |
| Net sales | $400,000 | $550,000 | $750,000 | $600,000 |
| Cost of goods sold | ||||
| Beginning inventory | $ 0 | $ 40,000 | $ 58,500 | $ 19,000 |
| Add: Production | $ 200,000 | $ 234,000 | $ 247,000 | $ 240,500 |
| Goods available for sale | $ 200,000 | $ 274,000 | $ 305,500 | $ 259,500 |
| Less: Ending inventory | (1) $ 40,000 | (2) $ 58,500 | (3) $ 19,000 | (4) $ 37,000 |
| Cost of goods sold | $ 160,000 | $ 215,500 | $ 286,500 | $ 222,500 |
| Gross Margin | $ 240,000 | $ 334,500 | $ 463,500 | $ 377,500 |
Table (1)
Working Note (1):
Ending inventory for 2018 is $40,000
Working Note (2):
Ending inventory for 2019 is $58,500
Working Note (3):
Ending inventory for 2020 is $19,000
Working Note (4):
Ending inventory for 2021 is $37,000
- b) Calculate the gross profit for the four years under LIFO method:
| Particulars | 2018 | 2019 | 2020 | 2021 |
| Amount ($) | Amount ($) | Amount ($) | Amount ($) | |
| Net sales | $400,000 | $550,000 | $750,000 | $600,000 |
| Cost of goods sold | ||||
| Beginning inventory | $ 0 | $ 40,000 | $ 59,500 | $ 20,000 |
| Add: Production | $ 200,000 | $ 234,000 | $ 247,000 | $ 240,500 |
| Goods available for sale | $ 200,000 | $ 274,000 | $ 306,500 | $ 260,500 |
| Less: Ending inventory | (5) $ 40,000 | (6) $ 59,500 | (7) $ 20,000 | (8) $ 38,500 |
| Cost of goods sold | $ 160,000 | $ 214,500 | $ 286,500 | $ 222,000 |
| Gross Margin | $ 240,000 | $ 335,500 | $ 463,500 | $ 378,000 |
Table (2)
Working Note (5):
Ending inventory for 2018 is $40,000
Working Note (6):
Ending inventory for 2019 is $59,500
Working Note (7):
Ending inventory for 2020 is $20,000
Working Note (8):
Ending inventory for 2021 is $38,500
- a) Calculate the gross profit for the four years under Average cost method:
Compute the cost of goods sold for average cost method:
| Year | Beginning inventory | Production | Goods available for sale | Average Unit | |||
| Units | Cost | Units | Cost | Units | Cost | Cost | |
| 2018 | 0 | $ 0 | 100,000 | $ 200,000 | 100,000 | $ 200,000 | $ 2.00 |
| 2019 | 20,000 | $ 40,000 | 120,000 | $ 234,000 | 140,000 | $ 274,000 | $ 1.957 |
| 2020 | 30,000 | $ 58,710 | 130,000 | $ 247,000 | 160,000 | $ 305,710 | $ 1.911 |
| 2021 | 10,000 | $ 19,110 | 130,000 | $ 240,500 | 140,000 | $ 259,610 | $ 1.854 |
Table (3)
| Year | Ending inventory | Cost of goods sold | ||
| Units | Cost | Units | Cost | |
| 2018 | 20,000 | $ 40,000 | 80,000 | $ 160,000 |
| 2019 | 30,000 | $ 58,710 | 110,000 | $ 215,290 |
| 2020 | 10,000 | $ 19,110 | 150,000 | $ 286,600 |
| 2021 | 20,000 | $ 37,080 | 120,000 | $ 222,530 |
Table (4)
Calculate the gross profit for the four years under Average cost method
| Particulars | 2018 | 2019 | 2020 | 2021 |
| Amount ($) | Amount ($) | Amount ($) | Amount ($) | |
| Net sales | $400,000 | $550,000 | $750,000 | $600,000 |
| Cost of goods sold | ||||
| Beginning inventory | $ 0 | $ 40,000 | $ 58,710 | $ 19,110 |
| Add: Production | $ 200,000 | $ 234,000 | $ 247,000 | $ 240,500 |
| Goods available for sale | $ 200,000 | $ 274,000 | $ 305,710 | $ 259,610 |
| Less: Ending inventory | $ 40,000 | $ 58,710 | $ 19,110 | $ 37,080 |
| Cost of goods sold | $ 160,000 | $ 215,290 | $ 286,600 | $ 222,530 |
| Gross Margin | $ 240,000 | $ 334,710 | $ 463,400 | $ 377,470 |
Table (5)
2.
Identify would return on asset would be greater under FIFO and LIFO.
Explanation of Solution
The net income and assets are higher under the FIFO method. There is a difference in the net income under both the methods.
Want to see more full solutions like this?
Chapter 7 Solutions
Intermediate Accounting: Reporting And Analysis


- Assume your company uses the periodic inventory costing method, and the inventory count left out an entire warehouse of goods that were in stock at the end of the year, with a cost value of $222,000. How will this affect your net income in the current year? How will it affect next years net income?arrow_forwardFava Company began operations in 2018 and used the LIFO inventory method for both financial reporting and income taxes. At the beginning of 2019, the anticipated cost trends in the industry had changed, so that it adopted the FIFO method for both financial reporting and income taxes. Fava reported revenues of 300,000 and 270,000 in 2019 and 2018, respectively. Fava reported expenses (excluding income tax expense) of 125,000 and 120,000 in 2019 and 2018, which included cost of goods sold of 55,000 and 45,000, respectively. An analysis indicates that the FIFO cost of goods sold would have been lower by 8,000 in 2018. The tax rate is 21%. Fava has a simple capital structure with 15,000 shares of common stock outstanding during 2018 and 2019. It paid no dividends in either year. Required: 1. Prepare the journal entry to reflect the change. 2. At the end of 2019, prepare the comparative income statements for 2019 and 2018. Notes to the financial statements are not necessary. 3. At the end of 2019, prepare the comparative retained earnings statements for 2019 and 2018.arrow_forwardLast year, Nikkola Company had net sales of 2,299,500,000 and cost of goods sold of 1,755,000,000. Nikkola had the following balances: Refer to the information for Nikkola Company above. Required: Note: Round answers to one decimal place. 1. Calculate the average inventory. 2. Calculate the inventory turnover ratio. 3. Calculate the inventory turnover in days. 4. CONCEPTUAL CONNECTION Based on these ratios, does Nikkola appear to be performing well or poorly?arrow_forward
- Renfro, Inc. was franchised on January 1, 2016. At the end of its third year of operations, December 31, 2018, management requested a study to determine what effect different materials inventory costing methods would have had on its reported net income over the three-year period. The materials inventory account, using LIFO, FIFO, and weighted average, would have had the following ending balances: a. Assuming the same number of units in ending inventory at the end of each year, were material costs rising or falling from 2016 to 2018? b. Which costing method would show the highest net income for 2017? c. Which method would show the lowest net income for 2018? d. Which method would show the highest net income for the three years combined?arrow_forwardOlson Company adopted the dollar-value LIFO method for inventory valuation at the beginning of 2015. The following information about the inventory at the end of each year is available from Olsons records: Required: 1. Calculate the dollar-value LIFO inventory at the end of each year. 2. Prepare the appropriate disclosures for the 2021 annual report if Olson uses current cost internally and LIFO for financial reporting.arrow_forwardA large manufacturer of truck and car tires recently changed its cost-flow assumption method for inventories at the beginning of 2014. The manufacturer has been in operation for almost 40 years, and for the last decade it has reported moderate growth in revenues. The firm changed from the LIFO method to the FIFO method and reported the following information (amounts in millions): REQUIRED Calculate the inventory turnover ratio for 2014 using the LIFO and FIFO cost-flow assumption methods. Explain why the costs assigned to inventory under LIFO at the end of 2013 and 2014 are so much less than they are under FIFO.arrow_forward
- Dollar-Value LIFO Kwestel Company adopted the dollar-value LIFO method for inventory valuation at the beginning of 2015. The following information about the inventory at the end of each year is available from Kwestels records: Required: Calculate the dollar-value LIFO inventory at the end of each year. Round to the nearest dollar.arrow_forwardShaquille Corporation began the current year with inventory of 50,000. During the year, its purchases totaled 110,000. Shaquille paid freight charges of 8,500 for those purchases. At the end of the year, Shaquille had inventory of 47,800. Prepare a schedule to determine Shaquille's cost of goods sold for the current year.arrow_forwardThe general merchandise retail industry has a number of segments represented by the following companies: For a recent year, the following cost of goods sold and beginning and ending inventories are provided from corporate annual reports (in millions) for these three companies: a. Determine the inventory turnover ratio for all three companies. Round all calculations to one decimal place. b. Determine the number of days sales in inventory for all three companies. Use 365 days and round all calculations to one decimal place. c. Interpret these results based on each companys merchandising concept.arrow_forward
- Refer to RE22-2. Assume Heller Company had sales revenue of 510,000 in 2019 and 650,000 in 2020. Prepare Hellers partial income statements (through gross profit) for 2019 and 2020. RE22-2 Heller Company began operations in 2019 and used the LIFO method to compute its 300,000 cost of goods sold for that year. At the beginning of 2020, Heller changed to the FIFO method. Heller determined that its cost of goods sold under FIFO would have been 250,000 in 2019. For 2020, Hellers cost of goods sold under FIFO was 360,000, while it would have been 410,000 under LIFO. Heller is subject to a 21% income tax rate. Compute the cumulative effect of the retrospective adjustment on prior years income (net of taxes) that Heller would report on its retained earnings statement for 2020.arrow_forwardUse the following information relating to Clover Company to calculate the inventory turnover ratio, gross margin, and the number of days sales in inventory ratio, for years 2022 and 2023.arrow_forwardLIFO and Inventory Pools On January 1, 2016, Grover Company changed its inventory cost flow method to the LIFO cost method from the FIFO cost method for its raw materials inventory. It made the change for both financial statement and income tax reporting purposes. Grover uses the multiple-pools approach under which it groups substantially identical raw materials into LIFO inventory pools. It uses weighted average costs in valuing annual incremental layers. The composition of the December 31, 2018, inventory for the Class F inventory pool is as follows: Inventory transactions for the Class F inventory pool during 2019 were as follows: On March 2, 2019, 4,800 units were purchased at a unit cost of 13.50 for 64,800. On September 1, 2019, 7,200 units were purchased at a unit cost of 14.00 for 100,800. A total of 15,000 units were used for production during 2019. The following transactions for the Class F inventory pool took place during 2020: On January 11, 2020, 7,500 units were purchased at a unit cost of 14.50 for 108,750. On May 14, 2020, 5,500 units were purchased at a unit cost of 15.50 for 85,250. On December 29, 2020, 7,000 units were purchased at a unit cost of 16.00 for 112,000. A total of 16,000 units were used for production during 2020. Required: 1. Prepare a schedule to compute the inventory (units and dollar amounts) of the Class F inventory pool at December 31, 2019. Show supporting computations in good form. 2. Prepare a schedule to compute the cost of Class F raw materials used in production for the year ended December 31, 2019. 3. Prepare a schedule to compute the inventory (units and dollar amounts) of the Class F inventory pool at December 31, 2020. Show supporting computations in good form.arrow_forward
- Intermediate Accounting: Reporting And AnalysisAccountingISBN:9781337788281Author:James M. Wahlen, Jefferson P. Jones, Donald PagachPublisher:Cengage Learning
 Financial And Managerial AccountingAccountingISBN:9781337902663Author:WARREN, Carl S.Publisher:Cengage Learning,
 Financial Accounting: The Impact on Decision Make...AccountingISBN:9781305654174Author:Gary A. Porter, Curtis L. NortonPublisher:Cengage Learning
  Principles of Accounting Volume 1AccountingISBN:9781947172685Author:OpenStaxPublisher:OpenStax College
 Principles of Cost AccountingAccountingISBN:9781305087408Author:Edward J. Vanderbeck, Maria R. MitchellPublisher:Cengage Learning
 Cornerstones of Financial AccountingAccountingISBN:9781337690881Author:Jay Rich, Jeff JonesPublisher:Cengage Learning