
Concept explainers
Videos
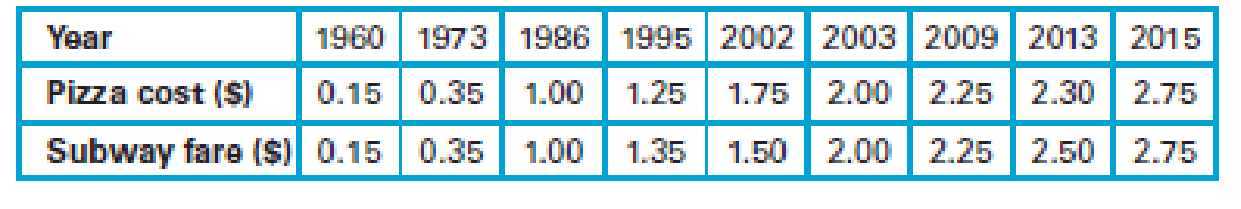
Pizza and the Subway. For Exercises 1–6, refer to the following table that lists the cost (in dollars) of a slice of pizza in New York City and the subway fare in the same year.
1. Construct a scatterplot. What does the result suggest?
Draw a scatter plot.
Explain the result from the scatter plot.
Answer to Problem 1CRE
- The scatter plot is given below:

Explanation of Solution
Calculation:
The costs of a slice of pizza and the subway fares in New York for a year are given.
Best-fit line:
In a scatter plot, the best possible straight line, which is closest to the points is called best-fit line.
Scatter plot with fitted line:
Software procedure:
Step-by-step software procedure to draw scatter plot using EXCEL software is as follows:
- Open an EXCEL file.
- In column A and B, the Pizza cost and Subway fare data were entered.
- Select the data > click on insert.
- Chose X Y (Scatter) from chart.
- Click OK.
- Click on the data points>right click> add trendline.
- Choose linear.
- Click on display equation on chart and display R-squared value on chart.
- Output using EXCEL software is given below:
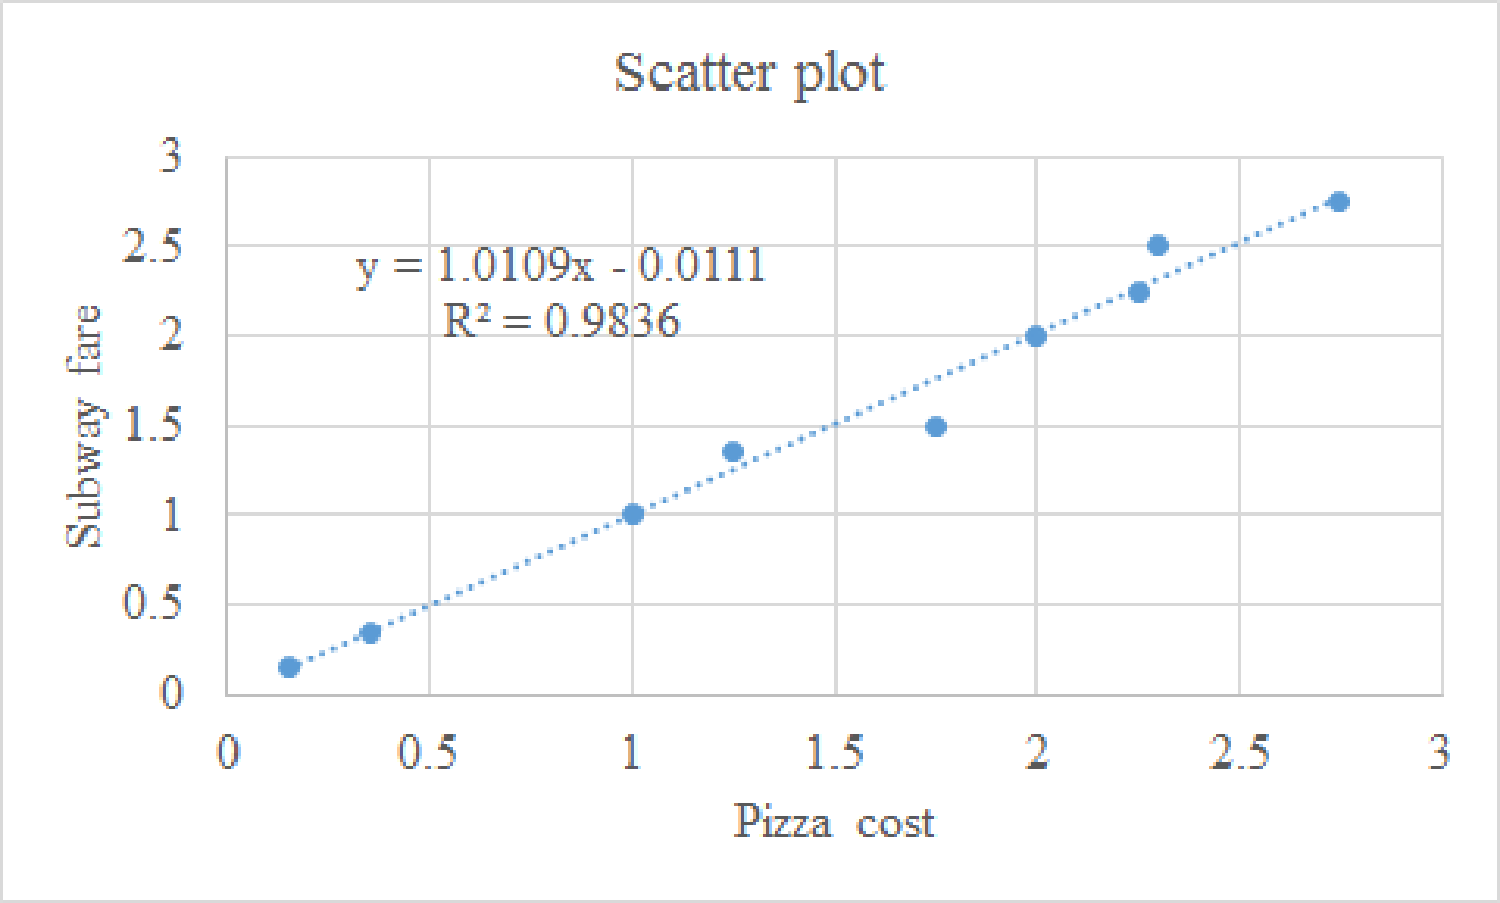
From the above scatter plot, it can be said that all the points are nearer to the best fitted line.
The coefficient of determination is 98.36%. Thus, 98.36% variability in subway fare can be explained by the pizza cost using the best fitted model.
Hence, it can be said that the fit is very good.
Moreover, it can be said that for increasing pizza cost, the subway fare has also increased and the trend line is an ascending trend line. Therefore, there is a strong positive correlation between the variables.
Want to see more full solutions like this?
Chapter 7 Solutions
Statistical Reasoning for Everyday Life - MyStatLab


- The chart below gives price and fuel efficiency for the Ford Escape, a small SUVs with conventional or hybrid engines from a web search on February 21, 2022. Car Model Price Average Mileage (mpg) Ford Escape S model (conventional) $26,510 28 city/ 34 highway Ford Escape SE (hybrid) $29,170 44 city/ 37 highway What is the annual cost to drive the conventional Ford Escape for 10,000 miles (5,000 city driving and 5,000 highway) if gas costs $3.57 per gallon? What is the annual cost to drive the hybrid model Ford Escape for 10,000 miles (5,000 city driving and 5,000 highway) if gas costs $3.57 per gallon? How much money would you save annually if you bought the hybrid model instead of the conventional Ford Escape, assuming you drove 10,000 miles each year? How many years of driving the more fuel-efficient hybrid would it take for you to make up difference in its higher sticker price over the price of the conventional model?arrow_forwardThe following equation describes the relationship between output and labor input at a sample of work stations in a manufacturing plant ŷ = 2.35+2.20X. Suppose, for a selected workstation, the labor input is 5, the predicted output is?arrow_forwardCellulon, a manufacturer of home insulation, wants to develop guidelines for builders and consumers on how the thickness of the insulation in the attic of a home and the outdoor temperature affect natural gas consumption. In the laboratory, it varied the insulation thickness and temperature. A few of the findings are: Monthly Natural Gas Consumption (cubic feet), Y Thickness of Insulation (inches), X1 Outdoor Temperature (°F), X2 30.3 6 40 26.9 12 40 22.1 8 49 How much natural gas can homeowners expect to use per month if they install 6 inches of insulation and the outdoor temperature is 40 degrees F? Group of answer choices 36.69 cubic feet 30.30 cubic feet 30.89 cubic feet 33.69 cubic feetarrow_forward
- The marketing team at P&G Company is developing an advertising campaign to promote their specialty products. They are considering the usage of Television (TV) and Social Media (SM) as the advertising media for their proposed campaign. The cost of making one TV ad is $1200 and the cost of making one SM ad is $600. P&G's advertising budget has been set at $30,000. The TV exposure rate is 600,000 per ad and SM exposure rate is 200,000 per ad. The following additional guidelines are to be considered. • Do not use more than 25 Social Media ads. • Use at least 35 combined TV and Social Media ads. • Ensure a minimum of 5000 exposures through Social Media exposures • The number of Social Media ads cannot be less than the number of TV ads. The Management at P&G would like to know how many TV and how many SM ads should be used to maximize the overall exposure rates of the advertising campaign • Describe the case briefly indicating its dimension (number of variables and…arrow_forwardThe per capita consumption of breakfast cereal in the US has the following model that appears below...arrow_forwardall spanish words are translated here Hoping to attract more commuters, an urban transportation company plans to run express bus service from a suburban terminal to the city's financial center. These buses should save travel time. The city decides to carry out a study of the effect of four different plans (for example a special lane and synchronized traffic lights) on the travel time of buses. Travel times (in minutes) are measured for multiple business days during peak hour travel when each of the plans is being implemented. The results appear in the table below. Anova: Single Factor The sum of the square of the errors is:arrow_forward
- Farmers know that driving heavy equipment on wet soil compresses the soil and injures future crops. Here are data on the "penetrability" of the same type of soil at two levels of compression. Penetrability is a measure of how much resistance plant roots will meet when they try to grow through the soil. Compressed Soil: 2.85 3.082.6 2.822.95 2.782.82 2.982.76 3.002.81 2.782.78 2.963.08 2.902.94 3.182.86 3.16 Intermediate Soil: 3.13 3.543.32 3.363.1 3.183.40 3.123.38 3.863.14 2.923.18 3.463.26 3.442.96 3.623.02 4.26 Use the data, omitting the high outlier, to give a 96% confidence interval for the decrease in penetrability of compressed soil relative to intermediate soil. Compute degrees of freedom using the conservative method.Interval: Toarrow_forwardYour best friend is adamant about competing in a mini-triathlon that consists of first a 2km endurance run, then a 2km hilly cycling, and lastly a 2km freestyle swim. She wants YOU, the mathematics expert, to design a guideline for her training. You determined that, to have a shot at winning, she must maintain an average speed of 5 km/h throughout the entire triathlon. She must run at 15 km/h and cycle at 30 km/h. What should be her swimming speed if she is to have a shot at winning?arrow_forwardData on advertising expenditures and revenue (in thousands of dollars) for the Four Seasons Restaurant follow. Advertising Expenditures Revenue 1 19 2 33 4 44 6 41 10 53 14 54 20 55arrow_forward
- urgenly need Part A and B Solution.arrow_forward3.) M/M/2 Mean Arrival Rate: 20 customers/hour Mean Service Rate: 12 customers/hour Number of Servers: 2 Customer Waiting Cost $10/hour Assume an 8-hour day. Assume the customer waiting cost is based on time in the system. What is the daily cost of customer waiting?arrow_forwardDixie Showtime table shows how weekly gross revenue is dependent on two variables the television and newspaper advertising expenses, is that correct? Discuss by givingthree new examples.arrow_forward
 Algebra: Structure And Method, Book 1AlgebraISBN:9780395977224Author:Richard G. Brown, Mary P. Dolciani, Robert H. Sorgenfrey, William L. ColePublisher:McDougal Littell
 Big Ideas Math A Bridge To Success Algebra 1: Stu...AlgebraISBN:9781680331141Author:HOUGHTON MIFFLIN HARCOURTPublisher:Houghton Mifflin Harcourt
 Algebra & Trigonometry with Analytic GeometryAlgebraISBN:9781133382119Author:SwokowskiPublisher:Cengage