FD - FINITE MATH...MYMATHLAB
12th Edition
ISBN: 9780135427880
Author: Goldstein
Publisher: PEARSON
bartleby

Concept explainers

bartleby

Videos

Textbook Question
Book Icon
Chapter 7, Problem 1FCCE

What is a bar chart? A pie chart? A histogram? A box plot?

Expert Solution & Answer
Check Mark
To determine

The meaning of a bar chart, a pie chart, a histogram and a box plot.

Explanation of Solution
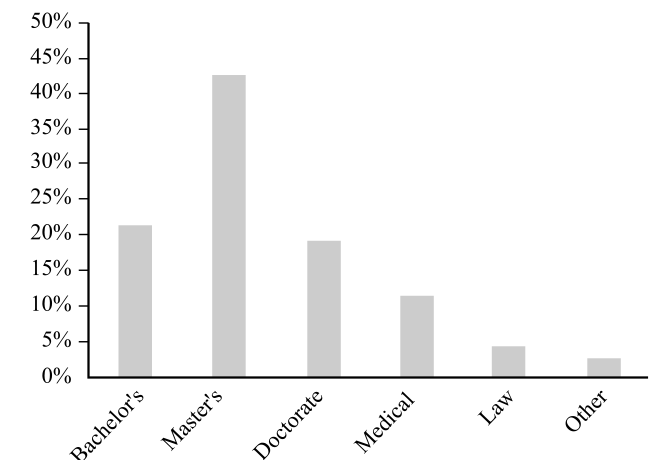
Bar chart:

Bar chart is a pictorial display of provided data by rectangular bars. Bar charts can be shown vertically or horizontally.

For example, the percentage of student to give highest degree planned to pursue, is provided in a table.

Highest degree planned Percentage
Bachelor’s 21.1
Master’s 42.1
Doctorate 19.0
Medical 11.2
Law 4.2
Others 2.4
Total 100.0

The representation of the data in a bar chart is provided below.
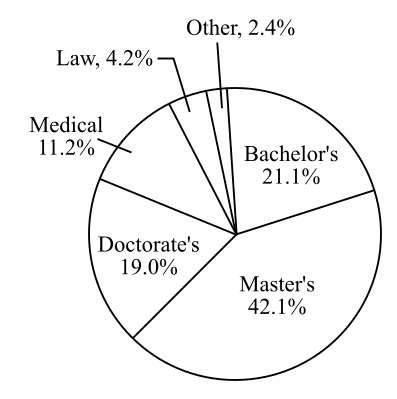
FD - FINITE MATH...MYMATHLAB, Chapter 7, Problem 1FCCE , additional homework tip  1

Pie chart:

Pie chart consists of a circle subdivided into sectors in which each sector corresponds to a category. The area of each sector is proportional to the percentage of items in that category.

For example, the data is shown in a tabular form.

Highest degree planned Percentage 360°×percent
Bachelor’s 21.1 76.0°
Master’s 42.1 151.6°
Doctorate 19.0 68.4°
Medical 11.2 40.3°
Law 4.2 15.1°
Others 2.4 8.6°

The representation of data in a pie chart is provided below.
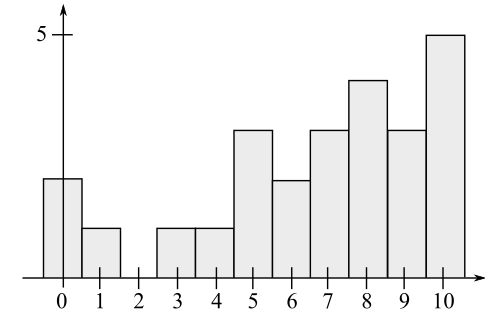
FD - FINITE MATH...MYMATHLAB, Chapter 7, Problem 1FCCE , additional homework tip  2

Histograms:

A histogram represents a graphical or visual interpretation of data. It is similar to the bar graph except, it has no gaps between the bars. The data are represented between x-axis and y-axis. The x-axis represents a scale of values and y-axis represents a value which corresponds to a value of x.

For example- the quiz score of 25 students of a class are,

8,7,6,10,5,10,7,1,8,0,10,5,9,3,8,6,10,4,9,10,7,0,9,5,8.

The quiz score data of students are shown in a tabular form.

Scores 0 1 2 3 4 5 6 7 8 9 10
Number of student 2 1 0 1 1 3 2 3 4 3 5

The representation of the quiz score data in a histogram is provided below.

FD - FINITE MATH...MYMATHLAB, Chapter 7, Problem 1FCCE , additional homework tip  3

Box plot:

A box plot shows a graphical representation of collection of data through quartiles. Quartiles are the medians of the sets of data to the left and right to the median.

The median of the numbers less than the median is called the first Quartile
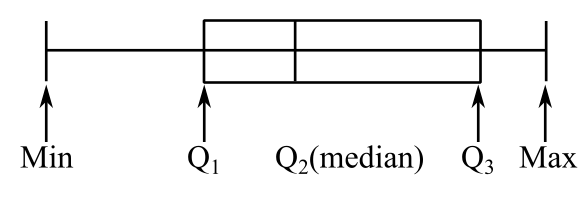
 (Q1) and the median of the numbers greater than the median is called third quartile (Q3). The general box plot is shown below.

FD - FINITE MATH...MYMATHLAB, Chapter 7, Problem 1FCCE , additional homework tip  4

Here, the Q1 and Q3 shows the ends of the box and Q2 shows the median of the box.

Want to see more full solutions like this?

Subscribe now to access step-by-step solutions to millions of textbook problems written by subject matter experts!

Chapter 7 Solutions

FD - FINITE MATH...MYMATHLAB

Ch. 7.1 - 8. U.S. Defense Employees Display the data from...Ch. 7.1 - Great Lakes Display the data from the table in...Ch. 7.1 - Bachelors Degrees Display the data from the table...Ch. 7.1 - Freshman Aspirations Exercises 11 and 12 refer to...Ch. 7.1 - Freshman Aspirations Exercises 11 and 12 refer to...Ch. 7.1 - 13. Vice Presidential Tie Breakers The number of...Ch. 7.1 - 14. Presidential Ages The ages at inauguration of...Ch. 7.1 - Quiz Scores The bar charts in Exercises 15 and 16...Ch. 7.1 - Quiz Scores The bar charts in Exercises 15 and 16...Ch. 7.1 - In Exercises 17 and 18, draw the box plot...Ch. 7.1 - In Exercises 17 and 18, draw the box plot...Ch. 7.1 - In Exercises 19–22, find the five-number summary...Ch. 7.1 - In Exercises 1922, find the five-number summary...Ch. 7.1 - Prob. 21ECh. 7.1 - Prob. 22ECh. 7.1 - 23. Match each of the histograms in column I with...Ch. 7.1 - Food Cost The box plot for the price (in cents) of...Ch. 7.1 - Prob. 25ECh. 7.1 - Prob. 26ECh. 7.1 - Batting Averages On April 16, 2016, the Toronto...Ch. 7.1 - In Exercises 28–31, use technology to produce...Ch. 7.1 - Prob. 29ECh. 7.1 - Prob. 30ECh. 7.1 - In Exercises 28–31, use technology to produce...Ch. 7.2 - 1. Carnival Game In a certain carnival game, a...Ch. 7.2 - Carnival Game Refer to the carnival game of...Ch. 7.2 - 1. Final Grades Table 11 gives the frequency...Ch. 7.2 - 2. Gas Queue The number of cars waiting to be...Ch. 7.2 - Weather Reports A local news website counted the...Ch. 7.2 - Production Level A production manager counted the...Ch. 7.2 - Coin Tosses A fair coin is tossed three times, and...Ch. 7.2 - 6. Archery An archer can hit the bull’s-eye of the...Ch. 7.2 - 7. Selecting Balls from an Urn An urn contains...Ch. 7.2 - 8. Rolling a Die A die is rolled, and the number...Ch. 7.2 - Carnival Game In a certain carnival game, the...Ch. 7.2 - 10. Carnival Game In a certain carnival game, a...Ch. 7.2 - 11. Figure 9 is the histogram for a probability...Ch. 7.2 - Figure 10 on the next page is the histogram for a...Ch. 7.2 - Let the random variables X and Y have the...Ch. 7.2 - Let the random variables X and Y have the...Ch. 7.2 - Let the random variables X and Y have the...Ch. 7.2 - Let the random variables X and Y have the...Ch. 7.2 - Let the random variables X and Y have the...Ch. 7.2 - Let the random variables X and Y have the...Ch. 7.2 - Let the random variables X and Y have the...Ch. 7.2 - Let the random variables X and Y have the...Ch. 7.2 - 21. Grade Distributions Two classes take the same...Ch. 7.2 - 22. Grade Distributions Use Table 16 to answer the...Ch. 7.2 - Exercises 23–26 refer to the tables and relative...Ch. 7.2 - Exercises 2326 refer to the tables and relative...Ch. 7.2 - Exercises 2326 refer to the tables and relative...Ch. 7.2 - Exercises 23–26 refer to the tables and relative...Ch. 7.2 - 27. Table 17 gives the probability distribution of...Ch. 7.2 - Table 18 gives the probability distribution of the...Ch. 7.2 - Table 19 gives the probability distribution of the...Ch. 7.2 - Prob. 30ECh. 7.3 - A number is selected at random from the numbers 0...Ch. 7.3 - 2. If the experiment in Problem 1 is repeated 20...Ch. 7.3 - Prob. 3CYUCh. 7.3 - In Exercises 14, calculate (kn)pkqnk for the given...Ch. 7.3 - In Exercises 1–4, calculate for the given values...Ch. 7.3 - In Exercises 14, calculate (kn)pkqnk for the given...Ch. 7.3 - In Exercises 1–4, calculate for the given values...Ch. 7.3 - Coin Tosses A coin is tossed 10 times. In...Ch. 7.3 - Coin Tosses A coin is tossed 10 times. In...Ch. 7.3 - Coin Tosses A coin is tossed 10 times. In...Ch. 7.3 - Coin Tosses A coin is tossed 10 times. In...Ch. 7.3 - Coin Tosses A coin is tossed 10 times. In...Ch. 7.3 - Coin Tosses A coin is tossed 10 times. In...Ch. 7.3 - Rolling a Die A single die is rolled four times....Ch. 7.3 - Rolling a Die A single die is rolled four times....Ch. 7.3 - Rolling a Die A single die is rolled four times....Ch. 7.3 - Rolling a Die A single die is rolled four times....Ch. 7.3 - Rolling a Die A single die is rolled four times....Ch. 7.3 - Rolling a Die A single die is rolled four times....Ch. 7.3 - Twenty-Somethings Fourteen percent of U.S....Ch. 7.3 - Twenty-Somethings Fourteen percent of U.S....Ch. 7.3 - Twenty-Somethings Fourteen percent of U.S....Ch. 7.3 - Twenty-Somethings Fourteen percent of U.S....Ch. 7.3 - Twenty-Somethings Fourteen percent of U.S....Ch. 7.3 - Twenty-Somethings Fourteen percent of U.S....Ch. 7.3 - Career Training According to the study The...Ch. 7.3 - Prob. 24ECh. 7.3 - Career Training According to the study The...Ch. 7.3 - Career Training According to the study The...Ch. 7.3 - 27. Children A family chosen at random has four...Ch. 7.3 - 28. New Employees A manager at a call center...Ch. 7.3 - College Acceptances Exercises 29 and 30 refer to...Ch. 7.3 - Prob. 30ECh. 7.3 - Prob. 31ECh. 7.3 - Veterinary Medicine Exercises 31 and 32 refer to...Ch. 7.3 - Car Sales An automotive salesman determines that...Ch. 7.3 - 34. Insurance Claims A homeowner’s insurance...Ch. 7.3 - Coin Tosses When a coin is tossed 100 times, the...Ch. 7.3 - Rolling Dice When a die is rolled 10 times, the...Ch. 7.3 - Figure 6 shows the histogram for a binomial random...Ch. 7.3 - 38. Figure 7 shows the histogram for a binomial...Ch. 7.3 - Prob. 39ECh. 7.3 - Prob. 40ECh. 7.3 - Centenarians The probability that a 20-year-old...Ch. 7.3 - 42. Left-handedness Ten percent of the population...Ch. 7.3 - 43. Drug Reaction Suppose that the probability of...Ch. 7.3 - Prob. 44ECh. 7.3 - Voter Polling Suppose that 60% of the voters in a...Ch. 7.3 - Jury Verdict A jury has 12 jurors. A vote of at...Ch. 7.3 - Quality Control Three percent of the circuit...Ch. 7.3 - Quality Control Refer to Example 1. What is the...Ch. 7.3 - Genetics Every offspring inherits a gene for hair...Ch. 7.3 - Theft of Gold A small country owns 10,000 gold...Ch. 7.3 - Prob. 51ECh. 7.3 - 52. Basketball A basketball player makes free...Ch. 7.3 - Basketball A basketball player makes 82% of her...Ch. 7.3 - 54. Darts The probability is .64 that a dartist...Ch. 7.3 - Tennis A single match at the mens U.S. Open...Ch. 7.3 - 56. Baseball The World Series consists of a...Ch. 7.3 - Prob. 57ECh. 7.3 - Prob. 58ECh. 7.3 - Prob. 59ECh. 7.3 - Prob. 60ECh. 7.3 - Prob. 61ECh. 7.3 - Prob. 62ECh. 7.3 - Prob. 63ECh. 7.3 - Prob. 64ECh. 7.3 - Prob. 66ECh. 7.3 - Prob. 67ECh. 7.3 - 68. Calculate the probability of between 45 and 55...Ch. 7.3 - Prob. 69ECh. 7.4 - Life Insurance A 74-year-old man pays $1000 for a...Ch. 7.4 - Prob. 2CYUCh. 7.4 - In Exercises 14, determine whether the quantity...Ch. 7.4 - In Exercises 14, determine whether the quantity...Ch. 7.4 - In Exercises 1–4, determine whether the quantity...Ch. 7.4 - In Exercises 14, determine whether the quantity...Ch. 7.4 - Find the expected value for the probability...Ch. 7.4 - Find the expected value for the probability...Ch. 7.4 - Grades A college student received the following...Ch. 7.4 - Gymnastic Scores An Olympic gymnast received the...Ch. 7.4 - 9. Comparing Toothpastes Table 12 gives the...Ch. 7.4 - 10. Investments Table 13 gives the possible...Ch. 7.4 - In Exercises 11–14, find the expected value for...Ch. 7.4 - In Exercises 11–14, find the expected value for...Ch. 7.4 - In Exercises 11–14, find the expected value for...Ch. 7.4 - In Exercises 1114, find the expected value for the...Ch. 7.4 - Roulette In American roulette, a bettor may place...Ch. 7.4 - 16. Roulette In American roulette, a dollar may be...Ch. 7.4 - Carnival Game In a carnival game, the player...Ch. 7.4 - Carnival Game In a carnival game, the player...Ch. 7.4 - 19. Life Insurance Using life insurance tables, a...Ch. 7.4 - Life Insurance Using life insurance tables, a...Ch. 7.4 - 21. Batting Averages Five members of a baseball...Ch. 7.4 - 22. Exam Scores Three members of a study group...Ch. 7.4 - Dice A pair of dice is rolled, and the larger of...Ch. 7.4 - Dice A pair of dice is rolled, and the smaller of...Ch. 7.4 - Chuck-a-Luck Redo Example 6, where the player wins...Ch. 7.4 - 26. Chuck-a-Luck Consider Example 6 with six...Ch. 7.4 - Bachelors Degrees According to the National Center...Ch. 7.4 - 28. Faculty Degrees According to the American...Ch. 7.4 - 29. Rolling a Die A die is rolled 30 times. What...Ch. 7.4 - Baseball Ted is a consistent .275 hitter. How many...Ch. 7.4 - Basketball A basketball player makes 40% of their...Ch. 7.4 - 32. Binomial Trials What is the probability of...Ch. 7.4 - Exercises 33–36 require the use of counting...Ch. 7.4 - Exercises 3336 require the use of counting...Ch. 7.4 - Exercises 33–36 require the use of counting...Ch. 7.4 - Exercises 33–36 require the use of counting...Ch. 7.4 - Rain Insurance The promoter of a football game is...Ch. 7.4 - Theft Insurance Bob wishes to insure a priceless...Ch. 7.4 - Ticket Sales Last weekend, a movie theater sold x...Ch. 7.4 - 40. Candle Sales A store sold an average...Ch. 7.4 - 41. Weather The average daily temperature during...Ch. 7.4 - Grades Jos wants to earn a 90% overall average in...Ch. 7.4 - 43. Mean If 5, 6, and x have the same average as...Ch. 7.4 - Game of Chance Table 14 gives the probability...Ch. 7.4 - 45. Factory Production An assembly line produces...Ch. 7.4 - 46. Weekly Revenue A small business had an average...Ch. 7.4 - 47. Truck Capacity A truck can carry a maximum of...Ch. 7.4 - Magazine Sales Half of the magazines at a...Ch. 7.5 - 1. (a) Compute the variance of the probability...Ch. 7.5 - 2. Refer to the probability distribution in Table...Ch. 7.5 - 1. Compute the variance of the probability...Ch. 7.5 - 2. Compute the variance of the probability...Ch. 7.5 - Determine by inspection which one of the...Ch. 7.5 - Determine by inspection which one of the...Ch. 7.5 - 5. Investment Returns Table 7 gives the...Ch. 7.5 - Golf Scores Two golfers recorded their scores for...Ch. 7.5 - Weekly Sales Table 8 gives the relative frequency...Ch. 7.5 - Course Grades Student A received the following...Ch. 7.5 - Coin Tosses Suppose that a coin is tossed 10...Ch. 7.5 - 10. Dice Suppose that a pair of dice is rolled 720...Ch. 7.5 - 11. Quality Control A manufacturer produces smart...Ch. 7.5 - 12. Basketball A basketball player makes each free...Ch. 7.5 - Chebychev Inequality Suppose that a probability...Ch. 7.5 - Chebychev Inequality Suppose that a probability...Ch. 7.5 - 15. Bulb Lifetimes For certain types of...Ch. 7.5 - 16. Quality Control An electronics firm determines...Ch. 7.5 - Prob. 17ECh. 7.5 - 18. Chebychev Inequality Suppose that a...Ch. 7.5 - Dice The probability distribution for the sum of...Ch. 7.5 - Dice The probability distribution, rounded to the...Ch. 7.5 - Variance Use the alternative formula for variance...Ch. 7.5 - 22. If X is a random variable, then the variance...Ch. 7.5 - Prob. 23ECh. 7.5 - Prob. 24ECh. 7.5 - 25. College Enrollments Table 12 gives the fall...Ch. 7.5 - Prob. 26ECh. 7.5 - Prob. 27ECh. 7.5 - Prob. 28ECh. 7.6 - Refer to Fig. 35(a). Find the value of z for which...Ch. 7.6 - Refer to the normal curve in Fig. 35(b). Express...Ch. 7.6 - In Exercises 1-8, use the table for A(z) (Table 2)...Ch. 7.6 - In Exercises 1-8, use the table for A(z) (Table 2)...Ch. 7.6 - In Exercises 1-8, use the table for A(z) (Table 2)...Ch. 7.6 - In Exercises 1-8, use the table for A(z) (Table 2)...Ch. 7.6 - In Exercises 1-8, use the table for (Table 2) to...Ch. 7.6 - In Exercises 1-8, use the table for (Table 2) to...Ch. 7.6 - In Exercises 1-8, use the table for (Table 2) to...Ch. 7.6 - In Exercises 1-8, use the table for A(z) (Table 2)...Ch. 7.6 - In Exercises 9-12, find the value of z for which...Ch. 7.6 - In Exercises 9-12, find the value of z for which...Ch. 7.6 - In Exercises 9-12, find the value of z for which...Ch. 7.6 - In Exercises 9-12, find the value of z for which...Ch. 7.6 - What is the 80th percentile of the standard normal...Ch. 7.6 - What is the 40th percentile of the standard normal...Ch. 7.6 - Prob. 15ECh. 7.6 - Prob. 16ECh. 7.6 - Prob. 17ECh. 7.6 - Prob. 18ECh. 7.6 - Exercises 1922 refer to the normal curve with...Ch. 7.6 - Exercises 19–22 refer to the normal curve with...Ch. 7.6 - Exercises 19–22 refer to the normal curve with...Ch. 7.6 - Exercises 1922 refer to the normal curve with...Ch. 7.6 - In Exercises 23-26, find the areas of the shaded...Ch. 7.6 - In Exercises 23-26, find the areas of the shaded...Ch. 7.6 - In Exercises 23-26, find the areas of the shaded...Ch. 7.6 - In Exercises 23-26, find the areas of the shaded...Ch. 7.6 - 27. What is the probability that an outcome of a...Ch. 7.6 - 28. What is the probability that an outcome of a...Ch. 7.6 - Find the value of for a normal random variable X...Ch. 7.6 - Find the value of for a normal random variable X...Ch. 7.6 - Elephant Heights Suppose that the height (at the...Ch. 7.6 - 32. Bottling Reliability At a soft-drink bottling...Ch. 7.6 - Manufacturing Reliability Bolts produced by a...Ch. 7.6 - Heights In a certain population, heights (in...Ch. 7.6 - 35. Manufacturing Reliability In a certain...Ch. 7.6 - 36. IQ Scores As measured with the Stanford-Binet...Ch. 7.6 - 37. Production Quotas The number of barrels of oil...Ch. 7.6 - Lightbulb Lifetimes Suppose that the lifetimes of...Ch. 7.6 - SAT Scores Assume that SAT verbal scores for a...Ch. 7.6 - 40. Mailing Bags A mail-order house uses an...Ch. 7.6 - Tire Lifetimes The lifetime of a certain brand of...Ch. 7.6 - Soft-Drink Dispenser Let X be the amount of soda...Ch. 7.6 - (True or False) A normal curve with a large value...Ch. 7.6 - Prob. 44ECh. 7.6 - Prob. 45ECh. 7.6 - Prob. 46ECh. 7.6 - Prob. 47ECh. 7.6 - Prob. 48ECh. 7.7 - 1. Drug Testing A new drug is being tested on...Ch. 7.7 - Prob. 2CYUCh. 7.7 - In Exercises 122, use the normal curve to...Ch. 7.7 - In Exercises 122, use the normal curve to...Ch. 7.7 - In Exercises 122, use the normal curve to...Ch. 7.7 - In Exercises 122, use the normal curve to...Ch. 7.7 - In Exercises 1–22, use the normal curve to ...Ch. 7.7 - In Exercises 122, use the normal curve to...Ch. 7.7 - In Exercises 122, use the normal curve to...Ch. 7.7 - In Exercises 122, use the normal curve to...Ch. 7.7 - In Exercises 122, use the normal curve to...Ch. 7.7 - In Exercises 1–22, use the normal curve to ...Ch. 7.7 - In Exercises 1–22, use the normal curve to ...Ch. 7.7 - In Exercises 1–22, use the normal curve to ...Ch. 7.7 - In Exercises 122, use the normal curve to...Ch. 7.7 - In Exercises 122, use the normal curve to...Ch. 7.7 - In Exercises 1–22, use the normal curve to ...Ch. 7.7 - In Exercises 122, use the normal curve to...Ch. 7.7 - In Exercises 1–22, use the normal curve to ...Ch. 7.7 - In Exercises 1–22, use the normal curve to ...Ch. 7.7 - In Exercises 1–22, use the normal curve to ...Ch. 7.7 - In Exercises 122, use the normal curve to...Ch. 7.7 - In Exercises 122, use the normal curve to...Ch. 7.7 - In Exercises 122, use the normal curve to...Ch. 7.7 - In Exercises 23–26, find the more precise answer...Ch. 7.7 - Prob. 24ECh. 7.7 - In Exercises 23–26, find the more precise answer...Ch. 7.7 - In Exercises 2326, find the more precise answer to...Ch. 7 - What is a bar chart? A pie chart? A histogram? A...Ch. 7 - Prob. 2FCCECh. 7 - What is a frequency distribution? A relative...Ch. 7 - Prob. 4FCCECh. 7 - Prob. 5FCCECh. 7 - What is meant by the probability distribution of a...Ch. 7 - Prob. 7FCCECh. 7 - Prob. 8FCCECh. 7 - Prob. 9FCCECh. 7 - Prob. 10FCCECh. 7 - Prob. 11FCCECh. 7 - Prob. 12FCCECh. 7 - Prob. 13FCCECh. 7 - U.S. Population Display the data from Table 1 in a...Ch. 7 - Find the five-number summary and the interquartile...Ch. 7 - Prob. 3RECh. 7 - Prob. 4RECh. 7 - Prob. 5RECh. 7 - 6. Archery An archer has probability .3 of hitting...Ch. 7 - 7. Guessing on an Exam A true–false exam consists...Ch. 7 - Dice A pair of fair dice is rolled 12 times. Note:...Ch. 7 - Table 2 gives the probability distribution of the...Ch. 7 - 10. Balls in an Urn An urn contains four red balls...Ch. 7 - The probability distribution of a random variable...Ch. 7 - Dice Game Lucy and Ethel play a game of chance in...Ch. 7 - 13. Suppose that a probability distribution has...Ch. 7 - Prob. 14RECh. 7 - Prob. 15RECh. 7 - Prob. 16RECh. 7 - 17. Heights of Adult Males The height of adult...Ch. 7 - Figure 3(a) is a standard normal curve. Find the...Ch. 7 - Figure 3(b) is a normal curve with =80and=15. Find...Ch. 7 - IQ Scores As measured with the Wechsler Adult...Ch. 7 - 21. Jury Selection In a certain city, 2/5 of the...Ch. 7 - Quality Control In a complicated production...Ch. 7 - Prob. 23RECh. 7 - Prob. 24RECh. 7 - Prob. 25RECh. 7 - Prob. 26RECh. 7 - If each number in a set of numbers is increased by...Ch. 7 - 28. If each number in a set of numbers is doubled,...Ch. 7 - Prob. 29RECh. 7 - Prob. 30RECh. 7 - An urn contains four red balls and six white...Ch. 7 - Prob. 2PCh. 7 - An urn contains four red balls and six white...Ch. 7 - An urn contains four red balls and six white...Ch. 7 - An urn contains four red balls and six white...Ch. 7 - An urn contains four red balls and six white...Ch. 7 - An urn contains four red balls and six white...Ch. 7 - An urn contains four red balls and six white...Ch. 7 - An urn contains four red balls and six white...

Additional Math Textbook Solutions

Find more solutions based on key concepts
Knowledge Booster
Background pattern image
Math
Learn more about
Need a deep-dive on the concept behind this application? Look no further. Learn more about this topic, subject and related others by exploring similar questions and additional content below.
Recommended textbooks for you
Text book image
Holt Mcdougal Larson Pre-algebra: Student Edition...
Algebra
ISBN:9780547587776
Author:HOLT MCDOUGAL
Publisher:HOLT MCDOUGAL
Text book image
Glencoe Algebra 1, Student Edition, 9780079039897...
Algebra
ISBN:9780079039897
Author:Carter
Publisher:McGraw Hill
Text book image
Big Ideas Math A Bridge To Success Algebra 1: Stu...
Algebra
ISBN:9781680331141
Author:HOUGHTON MIFFLIN HARCOURT
Publisher:Houghton Mifflin Harcourt
Which is the best chart: Selecting among 14 types of charts Part II; Author: 365 Data Science;https://www.youtube.com/watch?v=qGaIB-bRn-A;License: Standard YouTube License, CC-BY