Probability and Statistics for Engineering and the Sciences
9th Edition
ISBN: 9781305251809
Author: Jay L. Devore
Publisher: Cengage Learning
bartleby

Concept explainers

bartleby

Videos

Textbook Question
Book Icon
Chapter 7, Problem 47SE

Example 1.11 introduced the accompanying observations on bond strength.

Chapter 7, Problem 47SE, Example 1.11 introduced the accompanying observations on bond strength. a. Estimate true average

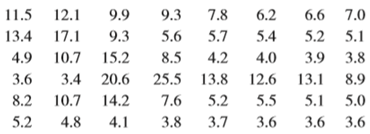
  1. a. Estimate true average bond strength in a way that conveys information about precision and reliability. [Hint: Σxi = 387.8 and x i 2 = 4247.08 .]
  2. b. Calculate a 95% CI for the proportion of all such bonds whose strength values would exceed 10.

a.

Expert Solution
Check Mark
To determine

Find the estimate of true average bond strength of observations.

Answer to Problem 47SE

The 95% confidence interval for population mean bond strength of observations is (6.702<μ<9.456)_

Explanation of Solution

Given info:

The data represents the bond strength of observations.

Calculation:

Here, the estimate of the true average bond strength of observations is obtained by finding the confidence interval about mean for the bond strength of observations.

The prior confidence level 95% is used to estimate the true average bond strength.

Sample standard deviation:

Step by step procedure to obtain sample standard deviation using the MINITAB software:

  • Choose Stat > Basic Statistics > Display descriptive statistics.
  • In Sample from columns, enter the column of bond strength.
  • In Options, select Standard deviation.
  • Click OK in all dialogue boxes.

Output using the MINITAB software is given below:

Probability and Statistics for Engineering and the Sciences, Chapter 7, Problem 47SE , additional homework tip  1

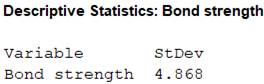
From MINITAB output, the sample standard deviation is 4.868.

Confidence interval:

Software Procedure:

Step by step procedure to obtain the 95% confidence interval to estimate the population mean bond strength of observations using the MINITAB software:

  • Choose Stat > Basic Statistics > 1-Sample z.
  • In Sample from columns, enter the column of bond strength.
  • Enter sample standard deviation as 4.868.
  • In Options, enter Confidence level as 95.0.
  • Choose not equal in alternative.
  • Click OK in all dialogue boxes.

Output using the MINITAB software is given below:

Probability and Statistics for Engineering and the Sciences, Chapter 7, Problem 47SE , additional homework tip  2

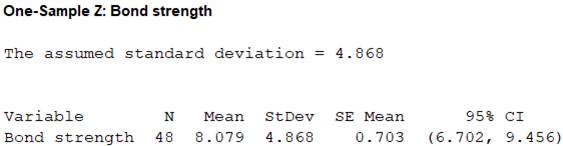
Thus, the 95% confidence interval for population mean bond strength of observations is (6.702<μ<9.456)_.

Interpretation:

There is 95% confident that the population mean bond strength of observations lies between 6.702 and 9.456.

b.

Expert Solution
Check Mark
To determine

Find the 95% confidence interval for the proportion of bond strengths greater than 10.

Answer to Problem 47SE

The 95% confidence interval for population proportion of bond strengths greater than 10 is (0.166<p<0.410)_

Explanation of Solution

Calculation:

Point estimate:

Here, the total number of bond strengths surveyed is n=48.

The number of bond strength values greater than 10 is 13.

That is, the number of specified characteristics is x=13.

The population proportion of bond strengths greater than 10 is obtained as follows:

p^=xn=1348=0.2708

Thus, the population proportion of bond strengths greater than 10 is p^=0.2708

Confidence interval:

Critical value:

For 95% level of significance,

1α=10.95α=0.05α2=0.052=0.025

Hence, the cumulative area to the left is,

Area to the left=1Area to the right=10.025=0.975

From Table A.3 of the standard normal distribution in Appendix , the critical value is 1.96.

Thus, the critical value is (zα2)=1.96.

Here, the sample size is n=48 which is large in size.

Hence, the population proportion is,

p˜=(p^+zα222×n)(1+zα22n)=0.2708+1.9622×481+1.96248=0.31081.0800=0.2878

Thus, the adjusted population proportion is p˜=0.2878

Confidence interval:

The upper bound of the confidence interval is,

CI=p˜±zα2×(p^×(1p^)n+zα224×n2)(1+zα2n)=0.2878±1.96×0.2708×(10.2708)48+1.9624×4821+1.96248=0.2878±0.1221(0.166,0.410)

Thus, the 95% confidence interval for the population proportion of bond strengths greater than 10 is (0.166<p<0.410)_.

Interpretation:

There is 95% confident that the population proportion of bond strengths greater than 10 lies between 0.166 and 0.410.

Want to see more full solutions like this?

Subscribe now to access step-by-step solutions to millions of textbook problems written by subject matter experts!

Chapter 7 Solutions

Probability and Statistics for Engineering and the Sciences

Ch. 7.1 - Consider the next 1000 95% CIs for that a...Ch. 7.2 - The following observations are lifetimes (days)...Ch. 7.2 - The article Gas Cooking. Kitchen Ventilation, and...Ch. 7.2 - The negative effects of ambient air pollution on...Ch. 7.2 - Determine the confidence level for each of the...Ch. 7.2 - The alternating current (AC) breakdown voltage of...Ch. 7.2 - Exercise 1.13 gave a sample of ultimate tensile...Ch. 7.2 - The U.S. Army commissioned a study to assess how...Ch. 7.2 - The article Limited Yield Estimation for Visual...Ch. 7.2 - TV advertising agencies face increasing challenges...Ch. 7.2 - In a sample of 1000 randomly selected consumers...Ch. 7.2 - The technology underlying hip replacements has...Ch. 7.2 - The Pew Forum on Religion and Public Life reported...Ch. 7.2 - A sample of 56 research cotton samples resulted in...Ch. 7.2 - The Pew Forum on Religion and Public Life reported...Ch. 7.2 - The superintendent of a large school district,...Ch. 7.2 - Reconsider the CI (7.10) for p, and focus on a...Ch. 7.3 - Determine the values of the following quantities:...Ch. 7.3 - Determine the t critical value(s) that will...Ch. 7.3 - Determine the t critical value for a two-sided...Ch. 7.3 - Determine the t critical value for a lower or an...Ch. 7.3 - According to the article Fatigue Testing of...Ch. 7.3 - The article Measuring and Understanding the Aging...Ch. 7.3 - A sample of 14 joint specimens of a particular...Ch. 7.3 - Silicone implant augmentation rhinoplasty is used...Ch. 7.3 - A normal probability plot of the n = 26...Ch. 7.3 - A study of the ability of individuals to walk in a...Ch. 7.3 - Ultra high performance concrete (UHPC) is a...Ch. 7.3 - Exercise 72 of Chapter 1 gave the following...Ch. 7.3 - Prob. 40ECh. 7.3 - A more extensive tabulation of t critical values...Ch. 7.4 - Determine the values of the following quantities:...Ch. 7.4 - Determine the following: a. The 95th percentile of...Ch. 7.4 - The amount of lateral expansion (mils) was...Ch. 7.4 - Wire electrical-discharge machining (WEDM) is a...Ch. 7.4 - Wire electrical-discharge machining (WEDM) is a...Ch. 7 - Example 1.11 introduced the accompanying...Ch. 7 - The article Distributions of Compressive Strength...Ch. 7 - For those of you who dont already know, dragon...Ch. 7 - A journal article reports that a sample of size 5...Ch. 7 - Unexplained respiratory symptoms reported by...Ch. 7 - High concentration of the toxic element arsenic is...Ch. 7 - Aphid infestation of fruit trees can be controlled...Ch. 7 - It is important that face masks used by...Ch. 7 - A manufacturer of college textbooks is interested...Ch. 7 - The accompanying data on crack initiation depth...Ch. 7 - In Example 6.8, we introduced the concept of a...Ch. 7 - Prob. 58SECh. 7 - Prob. 59SECh. 7 - Prob. 60SECh. 7 - Prob. 61SECh. 7 - Prob. 62SE
Knowledge Booster
Background pattern image
Statistics
Learn more about
Need a deep-dive on the concept behind this application? Look no further. Learn more about this topic, statistics and related others by exploring similar questions and additional content below.
Recommended textbooks for you
Text book image
Algebra & Trigonometry with Analytic Geometry
Algebra
ISBN:9781133382119
Author:Swokowski
Publisher:Cengage
Text book image
Glencoe Algebra 1, Student Edition, 9780079039897...
Algebra
ISBN:9780079039897
Author:Carter
Publisher:McGraw Hill
Text book image
Mathematics For Machine Technology
Advanced Math
ISBN:9781337798310
Author:Peterson, John.
Publisher:Cengage Learning,
Text book image
Trigonometry (MindTap Course List)
Trigonometry
ISBN:9781337278461
Author:Ron Larson
Publisher:Cengage Learning
Statistics 4.1 Point Estimators; Author: Dr. Jack L. Jackson II;https://www.youtube.com/watch?v=2MrI0J8XCEE;License: Standard YouTube License, CC-BY
Statistics 101: Point Estimators; Author: Brandon Foltz;https://www.youtube.com/watch?v=4v41z3HwLaM;License: Standard YouTube License, CC-BY
Central limit theorem; Author: 365 Data Science;https://www.youtube.com/watch?v=b5xQmk9veZ4;License: Standard YouTube License, CC-BY
Point Estimate Definition & Example; Author: Prof. Essa;https://www.youtube.com/watch?v=OTVwtvQmSn0;License: Standard Youtube License
Point Estimation; Author: Vamsidhar Ambatipudi;https://www.youtube.com/watch?v=flqhlM2bZWc;License: Standard Youtube License