EBK ELEMENTARY AND INTERMEDIATE ALGEBRA
6th Edition
ISBN: 9780321877949
Author: Johnson
Publisher: YUZU
expand_more
expand_more
format_list_bulleted
Videos
Textbook Question
Chapter 7.1, Problem 70ES
Researchers at Yale University have suggested that the following graphs * may represent three different aspects of love as a function of time.
* From “A Triangular Theory of Love,” by R. J. Sternberg, 1986, Psychological Review, 93(2), 119–135. Copyright 1986 by the American Psychological Association, Inc. Reprinted by permission.
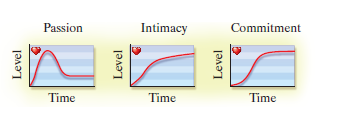
Do you agree with the researchers that these graphs should be shaped as they are? Why or why not?
Expert Solution & Answer
Want to see the full answer?
Check out a sample textbook solution
Students have asked these similar questions
Which is the following is not true about an independent variable?
a. an independent variable is represented on the horizontal axis of a graph
b. an independent variable varies as the dependent variable changes
an independent variable may take on the same value for 2 different data points
d. an independent variable can take on discrete or continuous values
e. none of the above
The following figure is from a paper about the role of the visual environment on attention & learning.
What story does this graph tell -- what is the main result?
Which of the following are reasons that are potential limitations to a research study? Choose all that apply.
People who were refused to answer
The graphs are drawn in a way to mislead the reader
The research was not able to survey every individual from the population
The funders of the project are partial to the results
Trying to conclude that there is a cause – and- effect relationship when something else causes both
Two factors cannot be separated to determine which is the one that is responsible to outcome
Chapter 7 Solutions
EBK ELEMENTARY AND INTERMEDIATE ALGEBRA
Ch. 7.1 - Determine whether the correspondence is a...Ch. 7.1 - 2. Determine whether the correspondence that...Ch. 7.1 - For the correspondence {(0,3),(4,7),(5,3)}, a....Ch. 7.1 - For the function g represented below, determine...Ch. 7.1 - 5. Find.
Ch. 7.1 - 6. Let.
a. What output corresponds to an input of...Ch. 7.1 - 7. The area of a square with side s is given by....Ch. 7.1 - Choose from the following list the word that best...Ch. 7.1 - Choose from the following list the word that best...Ch. 7.1 - Choose from the following list the word that best...
Ch. 7.1 - Choose from the following list the word that best...Ch. 7.1 - Choose from the following list the word that best...Ch. 7.1 - Choose from the following list the word that best...Ch. 7.1 - Choose from the following list the word that best...Ch. 7.1 - Choose from the following list the word that best...Ch. 7.1 - Determine whether each correspondence is a...Ch. 7.1 - Determine whether each correspondence is a...Ch. 7.1 - Determine whether each correspondence is a...Ch. 7.1 - Determine whether each correspondence is a...Ch. 7.1 - Determine whether each correspondence is a...Ch. 7.1 - Determine whether each correspondence is a...Ch. 7.1 - Determine whether each correspondence is a...Ch. 7.1 - Determine whether each correspondence is a...Ch. 7.1 - Determine whether each of the following is a...Ch. 7.1 - Determine whether each of the following is a...Ch. 7.1 - Determine whether each of the following is a...Ch. 7.1 - Determine whether each of the following is a...Ch. 7.1 - For each correspondence, (a) write the domain, (b)...Ch. 7.1 - For each correspondence, (a) write the domain, (b)...Ch. 7.1 - For each correspondence, (a) write the domain, (b)...Ch. 7.1 - For each correspondence, (a) write the domain, (b)...Ch. 7.1 - For each correspondence, (a) write the domain, (b)...Ch. 7.1 - For each correspondence, (a) write the domain, (b)...Ch. 7.1 - For each graph of a function, determine (a) f(1)...Ch. 7.1 - For each graph of a function, determine (a) f(1)...Ch. 7.1 - For each graph of a function, determine (a) f(1)...Ch. 7.1 - For each graph of a function, determine (a) f(1)...Ch. 7.1 - For each graph of a function, determine (a) f(1)...Ch. 7.1 - For each graph of a function, determine (a) f(1)...Ch. 7.1 - For each graph of a function, determine (a) f(1)...Ch. 7.1 - For each graph of a function, determine (a) f(1)...Ch. 7.1 - For each graph of a function, determine (a) f(1)...Ch. 7.1 - For each graph of a function, determine (a) f(1)...Ch. 7.1 - Determine whether each of the following is the...Ch. 7.1 - Determine whether each of the following is the...Ch. 7.1 - Determine whether each of the following is the...Ch. 7.1 - Determine whether each of the following is the...Ch. 7.1 - Determine whether each of the following is the...Ch. 7.1 - Determine whether each of the following is the...Ch. 7.1 - Find the function values. g(x)=2x+5 a. g(0) b....Ch. 7.1 - Find the function values. h(x)=5x1 a. h(4) b. h(8)...Ch. 7.1 - Find the function values.
45.
a.
b.
c.
d.
e....Ch. 7.1 - Find the function values.
46.
a.
b.
c.
d.
e....Ch. 7.1 - Find the function values. f(x)=x32x5 a. f(0) b....Ch. 7.1 - r(x)=3x42x+5 a. r(0) b. r(2) c. r(43) d. r(1) e....Ch. 7.1 - Fill in the missing values in each table f(x)=2x5...Ch. 7.1 - Fill in the missing values in each...Ch. 7.1 - Fill in the missing values in each table f(x)=2x5...Ch. 7.1 - Fill in the missing values in each table f(x)=2x5...Ch. 7.1 - Fill in the missing values in each...Ch. 7.1 - Fill in the missing values in each table f(x)=2x5...Ch. 7.1 - Fill in the missing values in each table f(x)=2x5...Ch. 7.1 - Fill in the missing values in each table f(x)=2x5...Ch. 7.1 - If f(x)=4x, for what input is the output 7?Ch. 7.1 - If f(x)=5x+1, for what input is the output 12 ?Ch. 7.1 - If f(x)=0.1x0.5, for what input is the output 3 ?Ch. 7.1 - 60. If, for what input is the output?
Ch. 7.1 - The function A described by gives the area of an...Ch. 7.1 - The function A described by gives the area of an...Ch. 7.1 - The function V described by V(r)=4r2 gives the...Ch. 7.1 - The function V described by gives the surface area...Ch. 7.1 - annual heart attack rate per 10,000 men as a...Ch. 7.1 - annual heart attack rate per 10,000 men as a...Ch. 7.1 - annual heart attack rate per 10,000 men as a...Ch. 7.1 - annual heart attack rate per 10,000 men as a...Ch. 7.1 - Researchers at Yale University have suggested that...Ch. 7.1 - Researchers at Yale University have suggested that...Ch. 7.1 - Solve. 2(x5)3=4(x1) [2.2]Ch. 7.1 - Solve.
72. [5.7]
Ch. 7.1 - Solve.
73. [5.7]
Ch. 7.1 - Solve.
74. [6.6]
Ch. 7.1 - Solve. 1x=x [6.6]Ch. 7.1 - Solve.
76. [5.7]
Ch. 7.1 - Solve. 13x+2=54+3x [2.2]Ch. 7.1 - Solve. x+1x=8 [6.6]Ch. 7.1 - 79. Jaylan is asked to write a function relating...Ch. 7.1 - For the function given by n(x)=ab+wz, what is the...Ch. 7.1 - For Exercises 81 and 82, let f(x)=3x21 and...Ch. 7.1 - For Exercises 81 and 82, let f(x)=3x21 and...Ch. 7.1 - 83. If f represents the function in Exercise 15,...Ch. 7.1 - 84. Suppose that a function g is such that. Find a...Ch. 7.1 - For each graph of a function, determine
a.
b....Ch. 7.1 - For each graph of a function, determine a. f(1) b....Ch. 7.1 - Pregnancy. For Exercises 8790, use the following...Ch. 7.1 - Pregnancy. For Exercises 87–90, use the following...Ch. 7.1 - Pregnancy. For Exercises 8790, use the following...Ch. 7.1 - Pregnancy. For Exercises 87–90, use the following...Ch. 7.1 - Pregnancy. For Exercises 87–90, use the following...Ch. 7.1 - List all numbers for which each rational...Ch. 7.1 - List all numbers for which each rational...Ch. 7.1 - List all numbers for which each rational...Ch. 7.1 - List all numbers for which each rational...Ch. 7.2 - 1. Find the domain and the range of the function ...Ch. 7.2 - 2. Find the domain and the range of the function ...Ch. 7.2 - 3. For the function represented below, determine
...Ch. 7.2 - 4. Find the domain and the range of the function ...Ch. 7.2 -
5. Find the domain of, if
Ch. 7.2 - The record R for the 1500-m run t years after 1930...Ch. 7.2 - In Example 7, find f(3).Ch. 7.2 - Indicate whether each of the following refers to...Ch. 7.2 - Indicate whether each of the following refers to...Ch. 7.2 - Indicate whether each of the following refers to...Ch. 7.2 - Indicate whether each of the following refers to...Ch. 7.2 - Indicate whether each of the following refers to...Ch. 7.2 - Indicate whether each of the following refers to...Ch. 7.2 - For Exercises 7 12 , use the function f given by
...Ch. 7.2 - For Exercises 7 12 , use the function f given by
...Ch. 7.2 - For Exercises 7-12, use the function f given by...Ch. 7.2 - For Exercises 7-12, use the function f given by...Ch. 7.2 - Prob. 11ESCh. 7.2 - Prob. 12ESCh. 7.2 - Prob. 13ESCh. 7.2 - Prob. 14ESCh. 7.2 - Prob. 15ESCh. 7.2 - Prob. 16ESCh. 7.2 - Prob. 17ESCh. 7.2 - Prob. 18ESCh. 7.2 - Prob. 19ESCh. 7.2 - Prob. 20ESCh. 7.2 - Prob. 21ESCh. 7.2 - Prob. 22ESCh. 7.2 - Prob. 23ESCh. 7.2 - Prob. 24ESCh. 7.2 - Prob. 25ESCh. 7.2 - Prob. 26ESCh. 7.2 - Prob. 27ESCh. 7.2 - Prob. 28ESCh. 7.2 - Prob. 29ESCh. 7.2 - Prob. 30ESCh. 7.2 - Prob. 31ESCh. 7.2 - Prob. 32ESCh. 7.2 - Prob. 33ESCh. 7.2 - Prob. 34ESCh. 7.2 - Prob. 35ESCh. 7.2 - Prob. 36ESCh. 7.2 - Prob. 37ESCh. 7.2 - Prob. 38ESCh. 7.2 - Prob. 39ESCh. 7.2 - Prob. 40ESCh. 7.2 - Prob. 41ESCh. 7.2 - Prob. 42ESCh. 7.2 - Prob. 43ESCh. 7.2 - Prob. 44ESCh. 7.2 - Prob. 45ESCh. 7.2 - Prob. 46ESCh. 7.2 - Prob. 47ESCh. 7.2 - Prob. 48ESCh. 7.2 - Prob. 49ESCh. 7.2 - Prob. 50ESCh. 7.2 - Pressure at sea Depth. The pressure p, in...Ch. 7.2 - Prob. 52ESCh. 7.2 - 53. Firework Displays. The height h, in feet, of...Ch. 7.2 - Prob. 54ESCh. 7.2 - Prob. 55ESCh. 7.2 - Find the indicated function values.
56.
a.
b....Ch. 7.2 - Find the indicated function values.
57.
a.
b....Ch. 7.2 - Find the indicated function values.
58.
a.
b....Ch. 7.2 - Prob. 59ESCh. 7.2 - Prob. 60ESCh. 7.2 - Prob. 61ESCh. 7.2 - 62. Chloe asserts that for a function described...Ch. 7.2 - Prob. 63ESCh. 7.2 - Prob. 64ESCh. 7.2 - Prob. 65ESCh. 7.2 - Prob. 66ESCh. 7.2 - Prob. 67ESCh. 7.2 - Prob. 68ESCh. 7.2 - Prob. 69ESCh. 7.2 - Prob. 70ESCh. 7.2 - Prob. 71ESCh. 7.2 - Prob. 72ESCh. 7.2 - Prob. 73ESCh. 7.2 - Prob. 74ESCh. 7.2 - Prob. 75ESCh. 7.2 - Prob. 76ESCh. 7.2 - Prob. 77ESCh. 7.2 - Prob. 78ESCh. 7.2 - Prob. 79ESCh. 7.2 - Prob. 80ESCh. 7.2 - Prob. 81ESCh. 7.2 - Prob. 82ESCh. 7.2 - Prob. 83ESCh. 7.2 - Prob. 84ESCh. 7.2 - For Exercises 8386, graph the functions given in...Ch. 7.2 - Prob. 86ESCh. 7.2 - Prob. 1QQCh. 7.2 - Prob. 2QQCh. 7.2 - Prob. 3QQCh. 7.2 - Prob. 4QQCh. 7.2 - Prob. 5QQCh. 7.2 - Prob. 1PTMOCh. 7.2 - Prob. 2PTMOCh. 7.2 - Prob. 3PTMOCh. 7.2 - Prob. 4PTMOCh. 7.2 - Prob. 5PTMOCh. 7.2 - Prob. 6PTMOCh. 7.2 - Prob. 1ECh. 7.2 - Prob. 2ECh. 7.2 - Prob. 3ECh. 7.2 - Prob. 4ECh. 7.2 - Prob. 5ECh. 7.2 - Prob. 6ECh. 7.2 - Prob. 7ECh. 7.2 - Prob. 8ECh. 7.3 - Prob. 1YTCh. 7.3 - Prob. 2YTCh. 7.3 - Prob. 3YTCh. 7.3 - Prob. 4YTCh. 7.3 - Prob. 5YTCh. 7.3 - Prob. 6YTCh. 7.3 - Prob. 7YTCh. 7.3 - Prob. 1ESCh. 7.3 - Prob. 2ESCh. 7.3 - Prob. 3ESCh. 7.3 - Prob. 4ESCh. 7.3 - Prob. 5ESCh. 7.3 - Prob. 6ESCh. 7.3 - Prob. 7ESCh. 7.3 - Prob. 8ESCh. 7.3 - Prob. 9ESCh. 7.3 - Prob. 10ESCh. 7.3 - Prob. 11ESCh. 7.3 - Prob. 12ESCh. 7.3 - Prob. 13ESCh. 7.3 - Prob. 14ESCh. 7.3 - Prob. 15ESCh. 7.3 - Prob. 16ESCh. 7.3 - Prob. 17ESCh. 7.3 - Prob. 18ESCh. 7.3 - Prob. 19ESCh. 7.3 - Prob. 20ESCh. 7.3 - Prob. 21ESCh. 7.3 - Prob. 22ESCh. 7.3 - Prob. 23ESCh. 7.3 - Prob. 24ESCh. 7.3 - Prob. 25ESCh. 7.3 - 26. Taxis. A taxi ride in Atlanta costs $2.25 plus...Ch. 7.3 - Prob. 27ESCh. 7.3 - Prob. 28ESCh. 7.3 - Prob. 29ESCh. 7.3 - Prob. 30ESCh. 7.3 - Prob. 31ESCh. 7.3 - Prob. 32ESCh. 7.3 - Prob. 33ESCh. 7.3 - Prob. 34ESCh. 7.3 - Prob. 35ESCh. 7.3 - Prob. 36ESCh. 7.3 - Prob. 37ESCh. 7.3 - Sellers Supply. Suppose that suppliers are willing...Ch. 7.3 - Prob. 39ESCh. 7.3 - Prob. 40ESCh. 7.3 - Classify each function as either a linear...Ch. 7.3 - Classify each function as either a linear...Ch. 7.3 - Classify each function as either a linear...Ch. 7.3 - Prob. 44ESCh. 7.3 - Prob. 45ESCh. 7.3 - Prob. 46ESCh. 7.3 - Prob. 47ESCh. 7.3 - Prob. 48ESCh. 7.3 - Prob. 49ESCh. 7.3 - Prob. 50ESCh. 7.3 - Prob. 51ESCh. 7.3 - Prob. 52ESCh. 7.3 - Prob. 53ESCh. 7.3 - Prob. 54ESCh. 7.3 - Prob. 55ESCh. 7.3 - Prob. 56ESCh. 7.3 - Prob. 57ESCh. 7.3 - Prob. 58ESCh. 7.3 - Prob. 59ESCh. 7.3 - Prob. 60ESCh. 7.3 - Prob. 61ESCh. 7.3 - Prob. 62ESCh. 7.3 - Prob. 63ESCh. 7.3 - Prob. 64ESCh. 7.3 - Prob. 65ESCh. 7.3 - Prob. 66ESCh. 7.3 - Prob. 67ESCh. 7.3 - 68. Explain why linear functions and quadratic...Ch. 7.3 - Prob. 69ESCh. 7.3 - Prob. 70ESCh. 7.3 - Prob. 71ESCh. 7.3 - Prob. 72ESCh. 7.3 - Prob. 73ESCh. 7.3 - Prob. 74ESCh. 7.3 - Prob. 75ESCh. 7.3 - Prob. 76ESCh. 7.3 - Prob. 77ESCh. 7.3 - Prob. 78ESCh. 7.3 - Prob. 79ESCh. 7.3 - Prob. 80ESCh. 7.3 - Prob. 81ESCh. 7.3 - Prob. 82ESCh. 7.3 - Prob. 83ESCh. 7.3 - Prob. 84ESCh. 7.3 - Prob. 85ESCh. 7.3 - Prob. 86ESCh. 7.3 - Prob. 1QQCh. 7.3 - Prob. 2QQCh. 7.3 - Prob. 3QQCh. 7.3 - Prob. 4QQCh. 7.3 - Prob. 5QQCh. 7.3 - Prob. 1PTMOCh. 7.3 - Prob. 2PTMOCh. 7.3 - Prob. 3PTMOCh. 7.3 - Prob. 4PTMOCh. 7.3 - Prob. 1MCRCh. 7.3 - Prob. 2MCRCh. 7.3 - Prob. 3MCRCh. 7.3 - Prob. 4MCRCh. 7.3 - Prob. 5MCRCh. 7.3 - Prob. 6MCRCh. 7.3 - Prob. 7MCRCh. 7.3 - Prob. 8MCRCh. 7.3 - Prob. 9MCRCh. 7.3 - Prob. 10MCRCh. 7.3 - Prob. 11MCRCh. 7.3 - Prob. 12MCRCh. 7.3 - Prob. 13MCRCh. 7.3 - Prob. 14MCRCh. 7.3 - Prob. 15MCRCh. 7.3 - Prob. 16MCRCh. 7.3 - Prob. 17MCRCh. 7.3 - Prob. 18MCRCh. 7.3 - Prob. 19MCRCh. 7.3 - Prob. 20MCRCh. 7.4 - Prob. 2YTCh. 7.4 - Prob. 4YTCh. 7.4 - Prob. 1ESCh. 7.4 - Prob. 2ESCh. 7.4 - Prob. 3ESCh. 7.4 - Prob. 4ESCh. 7.4 - Prob. 5ESCh. 7.4 - Prob. 6ESCh. 7.4 - Prob. 7ESCh. 7.4 - Prob. 8ESCh. 7.4 - Prob. 9ESCh. 7.4 - Prob. 10ESCh. 7.4 - Prob. 11ESCh. 7.4 - Prob. 12ESCh. 7.4 - Prob. 13ESCh. 7.4 - Prob. 14ESCh. 7.4 - Prob. 15ESCh. 7.4 - Prob. 16ESCh. 7.4 - Prob. 17ESCh. 7.4 - Prob. 18ESCh. 7.4 - Prob. 19ESCh. 7.4 - Prob. 20ESCh. 7.4 - Prob. 21ESCh. 7.4 - Prob. 22ESCh. 7.4 - Prob. 23ESCh. 7.4 - Prob. 24ESCh. 7.4 - Prob. 25ESCh. 7.4 - Prob. 26ESCh. 7.4 - Prob. 27ESCh. 7.4 - Prob. 28ESCh. 7.4 - Prob. 29ESCh. 7.4 - Prob. 30ESCh. 7.4 - Prob. 31ESCh. 7.4 - Prob. 32ESCh. 7.4 - Prob. 33ESCh. 7.4 - Prob. 34ESCh. 7.4 - Prob. 35ESCh. 7.4 - Prob. 36ESCh. 7.4 - Prob. 37ESCh. 7.4 - Prob. 38ESCh. 7.4 - Prob. 39ESCh. 7.4 - Prob. 40ESCh. 7.4 - Prob. 41ESCh. 7.4 - Prob. 42ESCh. 7.4 - Prob. 43ESCh. 7.4 - Prob. 44ESCh. 7.4 - Prob. 45ESCh. 7.4 - Prob. 46ESCh. 7.4 - Prob. 47ESCh. 7.4 - Prob. 48ESCh. 7.4 - Prob. 49ESCh. 7.4 - Prob. 50ESCh. 7.4 - Prob. 51ESCh. 7.4 - Prob. 52ESCh. 7.4 - Prob. 53ESCh. 7.4 - Prob. 54ESCh. 7.4 - Prob. 55ESCh. 7.4 - Prob. 56ESCh. 7.4 - Prob. 57ESCh. 7.4 - Prob. 58ESCh. 7.4 - Prob. 59ESCh. 7.4 - Prob. 60ESCh. 7.4 - Prob. 61ESCh. 7.4 - Prob. 62ESCh. 7.4 - Prob. 63ESCh. 7.4 - Prob. 64ESCh. 7.4 - Prob. 65ESCh. 7.4 - Prob. 66ESCh. 7.4 - Prob. 67ESCh. 7.4 - Prob. 68ESCh. 7.4 - Prob. 69ESCh. 7.4 - Prob. 70ESCh. 7.4 - Prob. 71ESCh. 7.4 - Prob. 72ESCh. 7.4 - Prob. 73ESCh. 7.4 - Prob. 74ESCh. 7.4 - Prob. 75ESCh. 7.4 - For Exercises 73-80, consider the function F and G...Ch. 7.4 - Prob. 77ESCh. 7.4 - Prob. 78ESCh. 7.4 - Prob. 79ESCh. 7.4 - Prob. 80ESCh. 7.4 - Prob. 81ESCh. 7.4 - Prob. 82ESCh. 7.4 - Prob. 83ESCh. 7.4 - Prob. 84ESCh. 7.4 - Prob. 85ESCh. 7.4 - Solve.
86. The flower bed in front of a school’s...Ch. 7.4 - Prob. 87ESCh. 7.4 - Prob. 88ESCh. 7.4 - Prob. 89ESCh. 7.4 - Prob. 90ESCh. 7.4 - Prob. 91ESCh. 7.4 - Prob. 92ESCh. 7.4 - Prob. 93ESCh. 7.4 - Prob. 94ESCh. 7.4 - Prob. 95ESCh. 7.4 - Prob. 96ESCh. 7.4 - Prob. 97ESCh. 7.4 - Prob. 98ESCh. 7.4 - Prob. 1QQCh. 7.4 - Prob. 2QQCh. 7.4 - Prob. 3QQCh. 7.4 - Prob. 4QQCh. 7.4 - Prob. 5QQCh. 7.4 - Prob. 1PTMOCh. 7.4 - Prob. 2PTMOCh. 7.4 - Prob. 3PTMOCh. 7.4 - Prob. 4PTMOCh. 7.4 - Solve. [2.3] abcd=3b+d, for bCh. 7.5 - Prob. 1YTCh. 7.5 - Prob. 2YTCh. 7.5 - Prob. 3YTCh. 7.5 - Prob. 4YTCh. 7.5 - Prob. 5YTCh. 7.5 - Prob. 6YTCh. 7.5 - Prob. 7YTCh. 7.5 -
8. Find an equation of variation if y varies...Ch. 7.5 - Prob. 9YTCh. 7.5 - Prob. 1ESCh. 7.5 - Prob. 2ESCh. 7.5 - Prob. 3ESCh. 7.5 - Prob. 4ESCh. 7.5 - Prob. 5ESCh. 7.5 - Prob. 6ESCh. 7.5 - Prob. 7ESCh. 7.5 - Prob. 8ESCh. 7.5 - Prob. 9ESCh. 7.5 - Prob. 10ESCh. 7.5 - Prob. 11ESCh. 7.5 - Prob. 12ESCh. 7.5 - Prob. 13ESCh. 7.5 - Prob. 14ESCh. 7.5 - Prob. 15ESCh. 7.5 - Prob. 16ESCh. 7.5 - Prob. 17ESCh. 7.5 - Prob. 18ESCh. 7.5 - Prob. 19ESCh. 7.5 - Prob. 20ESCh. 7.5 - Prob. 21ESCh. 7.5 - Prob. 22ESCh. 7.5 - Prob. 23ESCh. 7.5 - Prob. 24ESCh. 7.5 - Prob. 25ESCh. 7.5 - Prob. 26ESCh. 7.5 - Prob. 27ESCh. 7.5 - Prob. 28ESCh. 7.5 - Prob. 29ESCh. 7.5 - Prob. 30ESCh. 7.5 - Prob. 31ESCh. 7.5 - Prob. 32ESCh. 7.5 - Prob. 33ESCh. 7.5 - Prob. 34ESCh. 7.5 - Prob. 35ESCh. 7.5 - Prob. 36ESCh. 7.5 - Prob. 37ESCh. 7.5 - Prob. 38ESCh. 7.5 - Prob. 39ESCh. 7.5 - Prob. 40ESCh. 7.5 - Prob. 41ESCh. 7.5 - Prob. 42ESCh. 7.5 - Prob. 43ESCh. 7.5 - Prob. 44ESCh. 7.5 - Prob. 45ESCh. 7.5 - Prob. 46ESCh. 7.5 - Prob. 47ESCh. 7.5 - Prob. 48ESCh. 7.5 - Prob. 49ESCh. 7.5 - Prob. 50ESCh. 7.5 - Prob. 51ESCh. 7.5 - Prob. 52ESCh. 7.5 - Prob. 53ESCh. 7.5 - Prob. 54ESCh. 7.5 - Prob. 55ESCh. 7.5 - Prob. 56ESCh. 7.5 - Prob. 57ESCh. 7.5 - Prob. 58ESCh. 7.5 - Prob. 59ESCh. 7.5 - Prob. 60ESCh. 7.5 - Prob. 61ESCh. 7.5 - 62. Weight on Mars. The weight M of an abject on...Ch. 7.5 - String Length and Frequency. The frequency of a...Ch. 7.5 - Prob. 64ESCh. 7.5 - Prob. 65ESCh. 7.5 - Prob. 66ESCh. 7.5 - Prob. 67ESCh. 7.5 - Prob. 68ESCh. 7.5 - Prob. 69ESCh. 7.5 - Prob. 70ESCh. 7.5 - Prob. 71ESCh. 7.5 - Prob. 72ESCh. 7.5 - Prob. 73ESCh. 7.5 - Prob. 74ESCh. 7.5 - Prob. 75ESCh. 7.5 - Prob. 76ESCh. 7.5 - Prob. 77ESCh. 7.5 - Prob. 78ESCh. 7.5 - Prob. 79ESCh. 7.5 - Prob. 80ESCh. 7.5 - Prob. 81ESCh. 7.5 - Prob. 82ESCh. 7.5 - Prob. 83ESCh. 7.5 - 84. Drag Force. The drag force F on a boat varies...Ch. 7.5 - Prob. 85ESCh. 7.5 - Prob. 86ESCh. 7.5 - Prob. 87ESCh. 7.5 - Prob. 88ESCh. 7.5 - Prob. 89ESCh. 7.5 - Prob. 90ESCh. 7.5 - Prob. 91ESCh. 7.5 - Prob. 92ESCh. 7.5 - Prob. 93ESCh. 7.5 - Prob. 94ESCh. 7.5 - Prob. 95ESCh. 7.5 - Prob. 96ESCh. 7.5 - Prob. 97ESCh. 7.5 - Prob. 98ESCh. 7.5 - Prob. 99ESCh. 7.5 - Prob. 100ESCh. 7.5 - Prob. 101ESCh. 7.5 - Prob. 102ESCh. 7.5 - Prob. 103ESCh. 7.5 - Prob. 1QQCh. 7.5 - Prob. 2QQCh. 7.5 - Prob. 3QQCh. 7.5 - Prob. 4QQCh. 7.5 - Prob. 5QQCh. 7.5 - Prob. 1PTMOCh. 7.5 - Prob. 2PTMOCh. 7.5 - Prob. 3PTMOCh. 7.5 - Prob. 4PTMOCh. 7.5 - Prob. 5PTMOCh. 7.5 - Translate each of the following. Do not solve....Ch. 7 - Prob. 1RVSCh. 7 - Prob. 2RVSCh. 7 - Prob. 3RVSCh. 7 - Prob. 4RVSCh. 7 - Prob. 5RVSCh. 7 - Prob. 6RVSCh. 7 - Prob. 7RVSCh. 7 - Prob. 8RVSCh. 7 - Prob. 9RVSCh. 7 - Prob. 10RVSCh. 7 - Prob. 1ACh. 7 - Prob. 2ACh. 7 - Prob. 3ACh. 7 - Prob. 1DMCCh. 7 - Prob. 2DMCCh. 7 - Research. Estimate how much you (or a friend)...Ch. 7 - Prob. 1RECh. 7 - Prob. 2RECh. 7 - Classify each of the following statements as...Ch. 7 - Prob. 4RECh. 7 - Classify each of the following statements as...Ch. 7 - Classify each of the following statements as...Ch. 7 - Prob. 7RECh. 7 - Prob. 8RECh. 7 - Prob. 9RECh. 7 - Prob. 10RECh. 7 - Prob. 11RECh. 7 - Prob. 12RECh. 7 - Prob. 13RECh. 7 - Prob. 14RECh. 7 - Prob. 15RECh. 7 - Prob. 16RECh. 7 - Prob. 17RECh. 7 - Prob. 18RECh. 7 - Prob. 19RECh. 7 - Prob. 20RECh. 7 - Prob. 21RECh. 7 - Prob. 22RECh. 7 - Prob. 23RECh. 7 - Prob. 24RECh. 7 - Prob. 25RECh. 7 - Prob. 26RECh. 7 - Prob. 27RECh. 7 - Prob. 28RECh. 7 - Prob. 29RECh. 7 - Prob. 30RECh. 7 - Prob. 31RECh. 7 - Prob. 32RECh. 7 - Prob. 33RECh. 7 - Prob. 34RECh. 7 - Prob. 35RECh. 7 - Prob. 36RECh. 7 - Prob. 37RECh. 7 - Prob. 38RECh. 7 - Prob. 39RECh. 7 - Prob. 40RECh. 7 - Prob. 41RECh. 7 - Prob. 42RECh. 7 - Prob. 43RECh. 7 - Prob. 44RECh. 7 - Prob. 45RECh. 7 - Prob. 46RECh. 7 - Prob. 47RECh. 7 - Prob. 48RECh. 7 - Prob. 49RECh. 7 - Prob. 50RECh. 7 - 51. Treasure Tea charges $7.99 for each package of...Ch. 7 - Prob. 52RECh. 7 - Prob. 1TCh. 7 - Prob. 2TCh. 7 - Prob. 3TCh. 7 - Prob. 4TCh. 7 - Prob. 5TCh. 7 - Prob. 6TCh. 7 - Prob. 7TCh. 7 - Prob. 8TCh. 7 - Prob. 9TCh. 7 - Prob. 10TCh. 7 - Prob. 11TCh. 7 - Prob. 12TCh. 7 - Prob. 13TCh. 7 - Prob. 14TCh. 7 - Prob. 15TCh. 7 - Prob. 16TCh. 7 - Prob. 17TCh. 7 - Prob. 18TCh. 7 - Prob. 19TCh. 7 - Prob. 20TCh. 7 - Prob. 21TCh. 7 - Prob. 22TCh. 7 - The number of workers n needed to clean a stadium...Ch. 7 - Prob. 24TCh. 7 - Prob. 25TCh. 7 - Prob. 26TCh. 7 - Prob. 1CRCh. 7 - Prob. 2CRCh. 7 - Prob. 3CRCh. 7 - Prob. 4CRCh. 7 - Prob. 5CRCh. 7 - Prob. 6CRCh. 7 - Prob. 7CRCh. 7 - Prob. 8CRCh. 7 - Prob. 9CRCh. 7 - Prob. 10CRCh. 7 - Prob. 11CRCh. 7 - Prob. 12CRCh. 7 - Prob. 13CRCh. 7 - Prob. 14CRCh. 7 - Prob. 15CRCh. 7 - Prob. 16CRCh. 7 - Prob. 17CRCh. 7 - Prob. 18CRCh. 7 - Prob. 19CRCh. 7 - Prob. 20CRCh. 7 - Prob. 21CRCh. 7 - Prob. 22CRCh. 7 - Prob. 23CRCh. 7 - Prob. 24CRCh. 7 - Prob. 25CRCh. 7 - Prob. 26CRCh. 7 - Prob. 27CRCh. 7 - Prob. 28CRCh. 7 - Prob. 29CRCh. 7 - Prob. 30CRCh. 7 - Prob. 31CRCh. 7 - Prob. 32CRCh. 7 - The time t that it takes for Johann to drive to...Ch. 7 - Prob. 34CRCh. 7 - Prob. 35CRCh. 7 - Prob. 36CR
Knowledge Booster


Learn more about
Need a deep-dive on the concept behind this application? Look no further. Learn more about this topic, algebra and related others by exploring similar questions and additional content below.Similar questions
- 2.31 The median income for a four-person family has been reported as shown here for 1993–2003. Source: Time Almanac 2006, p. 627. 1993 $45,161 1999 $59,981 1998 56,061 1994 47,012 2000 62,228 1995 49,687 2001 63,278 1996 51,518 2002 62,732 1997 53,350 2003 65,093 Construct a line graph describing these data over time.arrow_forwardDr. Chidi Anagonye studied how self-esteem (high versus low) and success on a school project (passed/succeeded or failed) influences whether students attribute the cause of the outcome to themselves or others. High scores on the dependent variable mean they attribute the outcome to themselves and low scores mean they attributed the outcome to others. Below are his results. Look at the graph below and select the statement that is most true about the graph: Attribution to Self 8 A 9 5 + 3 Low Self Esteem Success High Self Esteem O None of these are accurate Outcome There are 4 independent variables There is definitely an interaction There is definitely not an interaction Failurearrow_forwardIs there a relationship between autism and what an infant is fed? To determine if there is, a researcher asked mothers of autistic and non-autistic children to say what they fed their infant. The data are in table below a) Since data were collected for variable(s), the correct graph to make is a b) Which of the following is the correct graph for the above data with Feeding grouped by Autism.arrow_forward
- Blood Pressure and Platelets Given below are the systolic blood pressure measurements (mm Hg) and blood platelet counts (1000 cells/μL) of the first few subjects included in Data Set 1 “Body Data” in Appendix B. Construct a graph suitable for exploring an association between systolic blood pressure and blood platelet count. What does the graph suggest about that association?arrow_forwardQuestion 19arrow_forwardQuestionvl 8. A relationship between two kinds of data is best represented by ------graph.arrow_forward
- The data in the following table provide the relationship between breast-cancer incidence rate and menopausal status by age, based on Nurses’ Health Study (NHS) data from 1976-1990. The incidence rate for each group is given in two ways - first as cases/person-years and then as (cases per 100,000 person-years). Age Premenopausal Postmenopausal 35-39 124/131,704 (94) 15/14,795 (101) 40-44 264/179,132 (147) 47/43,583 (108) 45-49 304/151,548 (201) 163/90,965 (179) 50-54 159/61,215 (260) 401/184,597 (217) 55-59 25/6133 (408) 490/180,458 (272) Problem 1 Assess whether there is a difference between the incidence rate of breast cancer for premenopausal vs. postmenopausal women, controlling for age. Write out all 4 steps of the hypothesis test including a two-tailed -value. Problem 2 Provide a point estimate of the incidence rate ratio for postmenopausal vs. premenopausal women after controlling for age. Support your estimate with a 95%…arrow_forwardЗа. Does a full moon affect the behavior for dementia patients in nursing homes? For a set of dementia patients in a nursing home, disruptive or aggressive behavior was recorded for full moon days (3 days centered at the day of the full moon) and other days. The results were as follows: Average number of disruptive incidents per day for dementia patients Patient 1 3 4 5 7 9. 10 11 12 13 14 15 Full moon 3.33 3.67 2.67 3.33 3.33 3.67 4.67 2.67 6.00 4.33 3.33 0.67 1.33 0.33 2.00 Other days 0.27 0.59 0.32 0.19 1.26 0.11 0.30 0.40 1.59 0.60 0.65 0.69 1.26 0.23 0.38 Does this evidence suggest that the full moon affects the behavior of dementia patients? Use a significance level of 0.10. b. Create a 95% confidence interval for the mean difference in aggressive behaviors per day.arrow_forwardA 7. The analyst in the Dorben Company made 10 independent time studies in the hand paint- spraying section of the finishing department. The product line under study revealed a direct relation between spraying time and product surface area. The following data were collected. Study No. 1 2 3 4 5 6 8 9 10 Surface Area 170 12 150 41 130 50 70 105 95 (sq. inches) Standard Time (hours) 0.32 0.11 0.31 0.14 0.27 0.18 7 120 0.24 0.23 0.25 (7a) Compute the slope and intercept constant using regression line equations. (7b) What is the correlation coefficient? (7c) How much spray time would you allow for a new part with a surface area of 250 sq. inches? 0.22arrow_forward
- Suppose that you work for the conservation of natural areas at the Bureau of Land Management. Your section concerns the effect of wildfires on natural areas. Your supervisor asked you to analyze the temporal trend in wildfires. In particular, she is interested in the following associations:1. Has the number of wildfires per year increased?2. Has the total burned area (in acre) per year increased?3. Has the burned area (in acre) per fire increased?The accompanied data file contains the number of wildfires, total burned area, and burned area per fire in the U.S. from 2000 to 2019. Question 1. Using Excel, create three scatter plots which show each association (year and number of wildfires, year and total burned area, and year and burned area per fire). Clearly label the graphs. Note that year should be on the x-axis. Attach the scatterplot to this report. Refer to the textbook 12.2. (15 pts.) Question 2. Using the scatter plots created in Question 1, perform a visual assessments.…arrow_forwardProvide an appropriate graph for the given dataarrow_forwardBody Temperatures Listed below are the temperatures from nine males measured at 8 AM and again at 12 AM (from Data Set 3 “Body Temperatures” in Appendix B). Construct a scatterplot. Based on the graph, does there appear to be a relationship between 8 AM temperatures and 12 AM temperatures?arrow_forward
arrow_back_ios
SEE MORE QUESTIONS
arrow_forward_ios
Recommended textbooks for you
 Glencoe Algebra 1, Student Edition, 9780079039897...AlgebraISBN:9780079039897Author:CarterPublisher:McGraw Hill
 Algebra & Trigonometry with Analytic GeometryAlgebraISBN:9781133382119Author:SwokowskiPublisher:Cengage
 Big Ideas Math A Bridge To Success Algebra 1: Stu...AlgebraISBN:9781680331141Author:HOUGHTON MIFFLIN HARCOURTPublisher:Houghton Mifflin Harcourt
Glencoe Algebra 1, Student Edition, 9780079039897...
Algebra
ISBN:9780079039897
Author:Carter
Publisher:McGraw Hill
Algebra & Trigonometry with Analytic Geometry
Algebra
ISBN:9781133382119
Author:Swokowski
Publisher:Cengage
Big Ideas Math A Bridge To Success Algebra 1: Stu...
Algebra
ISBN:9781680331141
Author:HOUGHTON MIFFLIN HARCOURT
Publisher:Houghton Mifflin Harcourt
Sine, Cosine and Tangent graphs explained + how to sketch | Math Hacks; Author: Math Hacks;https://www.youtube.com/watch?v=z9mqGopdUQk;License: Standard YouTube License, CC-BY