
Probability and Statistics for Engineering and the Sciences
9th Edition
ISBN: 9781305251809
Author: Jay L. Devore
Publisher: Cengage Learning
expand_more
expand_more
format_list_bulleted
Videos
Textbook Question
thumb_up100%
Chapter 7.2, Problem 17E
Exercise 1.13 gave a sample of ultimate tensile strength observations (ksi). Use the accompanying
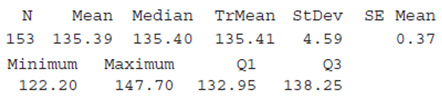
| N | Mean | Median | TrMean | StDev | SE Mean |
| 153 | 135.39 | 135.40 | 135.41 | 4.59 | 0.37 |
| Minimum | Maximum | Q1 | Q3 |
| 122.20 | 147.70 | 132.95 | 138.25 |
Expert Solution & Answer

Trending nowThis is a popular solution!

Students have asked these similar questions
In Exercises, presume that the assumptions for regression inferences are met.Crown-Rump Length. Following are the data on age of fetuses and length of crown-rump from Exercise.
x
10
10
13
13
18
19
19
23
25
28
y
66
66
108
106
161
166
177
228
235
280
a. Determine a point estimate for the mean crown-rump length of all 19-week-old fetuses.b. Find a 90% confidence interval for the mean crown-rump length of all 19-week-old fetuses.c. Find the predicted crown-rump length of a 19-week-old fetus.d. Determine a 90% prediction interval for the crown-rump length of a 19-week-old fetus.ExerciseApplying the Concepts and SkillsIn Exercises, we repeat the information from Exercises. For each exercise here, discuss what satisfying Assumptions 1–3 for regression inferences by the variables under consideration would mean.
11.36 Use the data from Exercise 11.22.a. Estimate the mean time to run 10 km for athletes having a treadmill time of11 minutes.b. Place a 95% confidence interval on the mean time to run 10 km for athleteshaving a treadmill time of 11 minutes.
Refer to Exercise 7.S.6. Construct a 95% confidence interval for the population mean reduction in stem length. Does the confidence interval indicate whether the effect of stress is “horticulturally important,” if “horticulturally important” is defined as a reduction in population mean stem length of at least
1 cm
2 cm
5 cm
Chapter 7 Solutions
Probability and Statistics for Engineering and the Sciences
Ch. 7.1 - Consider a normal population distribution with the...Ch. 7.1 - Each of the following is a confidence interval for...Ch. 7.1 - Suppose that a random sample of 50 bottles of a...Ch. 7.1 - A CI is desired for the true average stray-load...Ch. 7.1 - Assume that the helium porosity (in percentage) of...Ch. 7.1 - On the basis of extensive tests, the yield point...Ch. 7.1 - By how much must the sample size n be increased if...Ch. 7.1 - Let 1 0, 2 0, with 1 + 2 = . Then P(z1X-/nz2)=1-...Ch. 7.1 - a. Under the same conditions as those leading to...Ch. 7.1 - A random sample of n = 15 heat pumps of a certain...
Ch. 7.1 - Consider the next 1000 95% CIs for that a...Ch. 7.2 - The following observations are lifetimes (days)...Ch. 7.2 - The article Gas Cooking. Kitchen Ventilation, and...Ch. 7.2 - The negative effects of ambient air pollution on...Ch. 7.2 - Determine the confidence level for each of the...Ch. 7.2 - The alternating current (AC) breakdown voltage of...Ch. 7.2 - Exercise 1.13 gave a sample of ultimate tensile...Ch. 7.2 - The U.S. Army commissioned a study to assess how...Ch. 7.2 - The article Limited Yield Estimation for Visual...Ch. 7.2 - TV advertising agencies face increasing challenges...Ch. 7.2 - In a sample of 1000 randomly selected consumers...Ch. 7.2 - The technology underlying hip replacements has...Ch. 7.2 - The Pew Forum on Religion and Public Life reported...Ch. 7.2 - A sample of 56 research cotton samples resulted in...Ch. 7.2 - The Pew Forum on Religion and Public Life reported...Ch. 7.2 - The superintendent of a large school district,...Ch. 7.2 - Reconsider the CI (7.10) for p, and focus on a...Ch. 7.3 - Determine the values of the following quantities:...Ch. 7.3 - Determine the t critical value(s) that will...Ch. 7.3 - Determine the t critical value for a two-sided...Ch. 7.3 - Determine the t critical value for a lower or an...Ch. 7.3 - According to the article Fatigue Testing of...Ch. 7.3 - The article Measuring and Understanding the Aging...Ch. 7.3 - A sample of 14 joint specimens of a particular...Ch. 7.3 - Silicone implant augmentation rhinoplasty is used...Ch. 7.3 - A normal probability plot of the n = 26...Ch. 7.3 - A study of the ability of individuals to walk in a...Ch. 7.3 - Ultra high performance concrete (UHPC) is a...Ch. 7.3 - Exercise 72 of Chapter 1 gave the following...Ch. 7.3 - Prob. 40ECh. 7.3 - A more extensive tabulation of t critical values...Ch. 7.4 - Determine the values of the following quantities:...Ch. 7.4 - Determine the following: a. The 95th percentile of...Ch. 7.4 - The amount of lateral expansion (mils) was...Ch. 7.4 - Wire electrical-discharge machining (WEDM) is a...Ch. 7.4 - Wire electrical-discharge machining (WEDM) is a...Ch. 7 - Example 1.11 introduced the accompanying...Ch. 7 - The article Distributions of Compressive Strength...Ch. 7 - For those of you who dont already know, dragon...Ch. 7 - A journal article reports that a sample of size 5...Ch. 7 - Unexplained respiratory symptoms reported by...Ch. 7 - High concentration of the toxic element arsenic is...Ch. 7 - Aphid infestation of fruit trees can be controlled...Ch. 7 - It is important that face masks used by...Ch. 7 - A manufacturer of college textbooks is interested...Ch. 7 - The accompanying data on crack initiation depth...Ch. 7 - In Example 6.8, we introduced the concept of a...Ch. 7 - Prob. 58SECh. 7 - Prob. 59SECh. 7 - Prob. 60SECh. 7 - Prob. 61SECh. 7 - Prob. 62SE
Knowledge Booster


Learn more about
Need a deep-dive on the concept behind this application? Look no further. Learn more about this topic, statistics and related others by exploring similar questions and additional content below.Similar questions
- Let x represent the hemoglobin count (HC) in grams per 100 milliliters of whole blood. The HC data below was gathered on 12 randomly selected healthy adult women. (Diagnostic Tests with Nursing Implications, Springhouse Corporation,1994 ). 19 14 23 20 15 19 21 16 18 18 16 21 Construct a 98% confidence interval to estimate the mean hemoglobin count of healthy adult women.arrow_forwardUse the Data Below: A) A potential car buyer is undecided on whether to buy a 2012 car with a front-wheel-drive (F) or with a rear-wheel-drive (R). Obtain the fuel efficiency mean, standard deviation, and the number of observations included in the sample for each type of these systems. B) Construct and interpret a 95% confidence interval for the true difference inmean city mileage (MPG) between front wheel drive (F) and rear wheel drive (R) systems. Assume that MPG of front wheel drive and rear wheel drive cars follow a normal distribution. *Note: You can use Excel or Rstudio or any means necessary comb_mpg drive_sys 13 R 16 R 16 R 15 R 16 R 27 R 27 R 19 R 21 R 19 R 18 R 19 R 17 R 18 R 12 R 23 R 25 R 24 R 17 R 14 R 26 R 26 R 23 R 22 R 16 R 16 R 36 R 36 R 22 R 21 R 21 R 20 R 21 R 24 R 22 R 23 R 22 R 23 R 22 R 24 R 22 R 23 R 22 R 23 R 22 R 15 R 13 R 14 R 13 R 15 R 19 R 17 R 17 R…arrow_forwardAn article contained the following observations on degree of polymerization for paper specimens for which viscosity times concentration fell in a certain middle range: 415 420 422 423 425 429 432 435 437 438 446 447 449 451 456 463 464 (c) Calculate a two-sided 95% confidence interval for true average degree of polymerization. (Round your answers to two decimal places.) ,arrow_forward
- The table below contains summary statistics about the trading density (sales per square metre, R/m2) for two random and independent samples of 18 housing developments in the Western Cape, and 13 housing developments in the Free State. Assume that the trading densities of the Western Cape and the Free State housing developments are normally distributed. Housing cost Western cape Free state Sample mean (R) 2500.2 2100.7 Sample standard deviation (R) 820.3 694.6 a. Estimate a 95% confidence interval for the standard deviation of the cost of housing developments in the Free State. b. Are the variances of the trading densities of housing developments in the Western Cape and the Free State are the same? Test at the 10% level. (Note: In answering this question, make sure you state the following: null and alternative hypotheses, test statistic and critical value. Write your final answers to 3 decimal places).c. Estimate a 90% confidence interval for the difference between the mean…arrow_forwardconsider babies born in the normal range of 37-43 weeks gestational age extensive data support the assumption that for such babies born in the united states birth weight is normally distributed with mean 7.56 pounds and standard deviation 1.06 pounds A- how big does a baby need to be, if we want them to be bigger than 99% of babies? B- how big does a baby need to be, to be in the first quartile (Q1) and quatile (Q3) C- how big does a baby need to be, to be in the 80th percentile?arrow_forward1. A recent survey showed that from a sample of 500 packages delivered by a Postal Service, 480were delivered on time. a) Construct a 95% confidence interval for the proportion of all packages that are deliveredon time by the Postal Service.arrow_forward
- In a survey funded by the UW school of medicine, 750 of 1000 adult Seattle residents said they did not believe they could come down with a sexually transmitted infection (STI). Construct a 95% confidence interval estimage of the proportion of adult Seattle residents who don't believe they can contract an STI. (Use a zz score of 1.96 for your computations.) a. (.728, .772) b. (.723, .777) c. (.718, .782) d. (.713, .878) e. (.665, .835)arrow_forwardIn a sample of seven cars, each car was tested for nitrogen-oxide emissions (in grams per mile) and the following results were obtained: 0.090.09, 0.190.19, 0.120.12, 0.160.16, 0.190.19, 0.170.17, 0.15 .0.15. Assuming that this sample is representative of the cars in use, construct a 9898% confidence interval estimate of the mean amount of nitrogen-oxide emissions for all cars. If the EPA requires that nitrogen-oxide emissions be less than 0.165 g divided by mig/mi, can we safely conclude that this requirement is being met?arrow_forwardGiven the R software output below, interpret the 90% confidence interval about the true mean diameter of Penicillium roqueforti colonies grown on petri dishes filled with malt extract agar. Data: The measurements of their diameters (mm.) are as follows: 38.6 39.0 35.2 34.1 32.9 42.4 37.5 52.6 45.9 60.0 29.1 47.7 61.7 41.7 43.5 50.2arrow_forward
- A random sample of 24 army recruits has a mean height of 68 inches with a standard deviation of 2.3 inches. If a 98% confidence interval is constructed, how many degrees of freedom would be allowed to find the t-critical value? a) 67 b) 97 c) 23arrow_forwardThe relationship between "strength" and "fineness" of cotton fibers was the subject of a study that produced the following data. (Give your answers correct to two decimal places.) x, Strength 76 69 71 76 83 72 78 74 80 82 y, Fineness 4.5 4.5 4.7 4.2 4.1 4.2 4.8 4.9 4.3 4.5 (b) Find the 98% confidence interval for the mean measurement of fineness for fibers with a strength of 79. Lower Limit Upper Limit (c) Find the 90% prediction interval for an individual measurement of fineness for fibers with a strength of 79. Lower Limit Upper Limitarrow_forwardA medical doctor who wanted to study the heights of adult men and women took a random sample of 150 adult men and 120 adult women and found the following summary results. Mean Height Standard Deviation Adult Men 170cm 8cm Adult Women 164cm 6cm Find a 90% confidence interval for the difference of mean height of adult men and women.arrow_forward
arrow_back_ios
SEE MORE QUESTIONS
arrow_forward_ios
Recommended textbooks for you
 MATLAB: An Introduction with ApplicationsStatisticsISBN:9781119256830Author:Amos GilatPublisher:John Wiley & Sons Inc
 Probability and Statistics for Engineering and th...StatisticsISBN:9781305251809Author:Jay L. DevorePublisher:Cengage Learning
 Statistics for The Behavioral Sciences (MindTap C...StatisticsISBN:9781305504912Author:Frederick J Gravetter, Larry B. WallnauPublisher:Cengage Learning
 Elementary Statistics: Picturing the World (7th E...StatisticsISBN:9780134683416Author:Ron Larson, Betsy FarberPublisher:PEARSON
 The Basic Practice of StatisticsStatisticsISBN:9781319042578Author:David S. Moore, William I. Notz, Michael A. FlignerPublisher:W. H. Freeman
 Introduction to the Practice of StatisticsStatisticsISBN:9781319013387Author:David S. Moore, George P. McCabe, Bruce A. CraigPublisher:W. H. Freeman
MATLAB: An Introduction with Applications
Statistics
ISBN:9781119256830
Author:Amos Gilat
Publisher:John Wiley & Sons Inc
Probability and Statistics for Engineering and th...
Statistics
ISBN:9781305251809
Author:Jay L. Devore
Publisher:Cengage Learning
Statistics for The Behavioral Sciences (MindTap C...
Statistics
ISBN:9781305504912
Author:Frederick J Gravetter, Larry B. Wallnau
Publisher:Cengage Learning
Elementary Statistics: Picturing the World (7th E...
Statistics
ISBN:9780134683416
Author:Ron Larson, Betsy Farber
Publisher:PEARSON
The Basic Practice of Statistics
Statistics
ISBN:9781319042578
Author:David S. Moore, William I. Notz, Michael A. Fligner
Publisher:W. H. Freeman
Introduction to the Practice of Statistics
Statistics
ISBN:9781319013387
Author:David S. Moore, George P. McCabe, Bruce A. Craig
Publisher:W. H. Freeman
Hypothesis Testing using Confidence Interval Approach; Author: BUM2413 Applied Statistics UMP;https://www.youtube.com/watch?v=Hq1l3e9pLyY;License: Standard YouTube License, CC-BY
Hypothesis Testing - Difference of Two Means - Student's -Distribution & Normal Distribution; Author: The Organic Chemistry Tutor;https://www.youtube.com/watch?v=UcZwyzwWU7o;License: Standard Youtube License