
Concept explainers
Videos
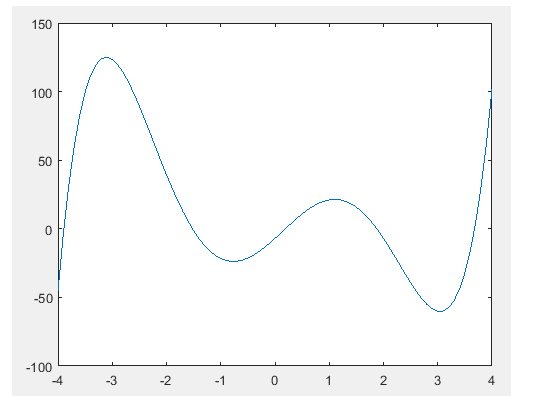
To plot:
The polynomial
Answer to Problem 1P
Solution:
The plot of the given polynomial
Explanation of Solution
The given polynomial function is,
The
Substitute the value of
Substitute the value of
Hence, the value of
Write the MATLAB script to plot the polynomial
MATLAB Code:
%MATLAB program to plot the polynomial function
x = -4:0.1:4;%Define a vector x.
y = [0.9 -0.3 -15.5 7 36 -7];
r = polyval(y,x);%polyval function is used to calculate y
plot(x,r)
Save the MATLAB script with name, Chapter8_56830_8_1P.m in the current folder. Execute the script by typing the script name at the command window to get the plot of the polynomial
Result:
Conclusion:
Therefore, the plot of the given polynomial
Want to see more full solutions like this?
Chapter 8 Solutions
MATLAB: An Introduction with Applications


 MATLAB: An Introduction with ApplicationsStatisticsISBN:9781119256830Author:Amos GilatPublisher:John Wiley & Sons Inc
 Probability and Statistics for Engineering and th...StatisticsISBN:9781305251809Author:Jay L. DevorePublisher:Cengage Learning
 Statistics for The Behavioral Sciences (MindTap C...StatisticsISBN:9781305504912Author:Frederick J Gravetter, Larry B. WallnauPublisher:Cengage Learning
 Elementary Statistics: Picturing the World (7th E...StatisticsISBN:9780134683416Author:Ron Larson, Betsy FarberPublisher:PEARSON
 The Basic Practice of StatisticsStatisticsISBN:9781319042578Author:David S. Moore, William I. Notz, Michael A. FlignerPublisher:W. H. Freeman
 Introduction to the Practice of StatisticsStatisticsISBN:9781319013387Author:David S. Moore, George P. McCabe, Bruce A. CraigPublisher:W. H. Freeman