
Concept explainers
Draw the influence lines for the vertical reactions at supports A and C.
Draw the influence lines for the shear and bending moment at point B.
Explanation of Solution
Calculation:
Apply a 1 k unit moving load at a distance of x from left end A.
Sketch the free body diagram of beam as shown in Figure 1.
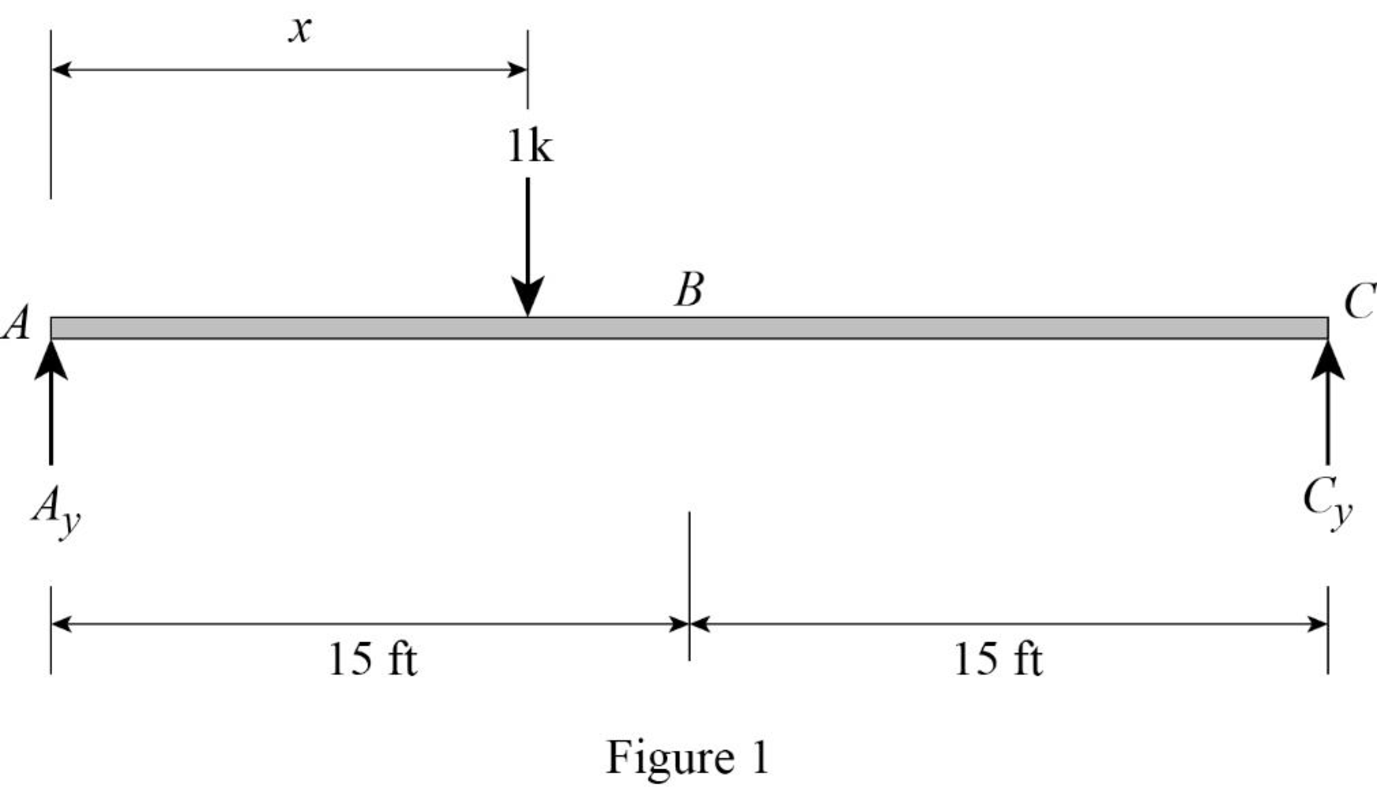
Refer Figure 1.
Find the equation of support reaction
Take moment about point C.
Consider moment equilibrium at point C.
Consider clockwise moment as positive and anticlockwise moment as negative
Sum of moment at point C is zero.
Find the equation of support reaction
Apply vertical equilibrium equation of forces.
Consider upward force as positive
Substitute
Consider Equation (1).
Find the value of influence line ordinate of reaction
Substitute 0 for x in Equation (1).
Similarly calculate the influence line ordinate of reaction
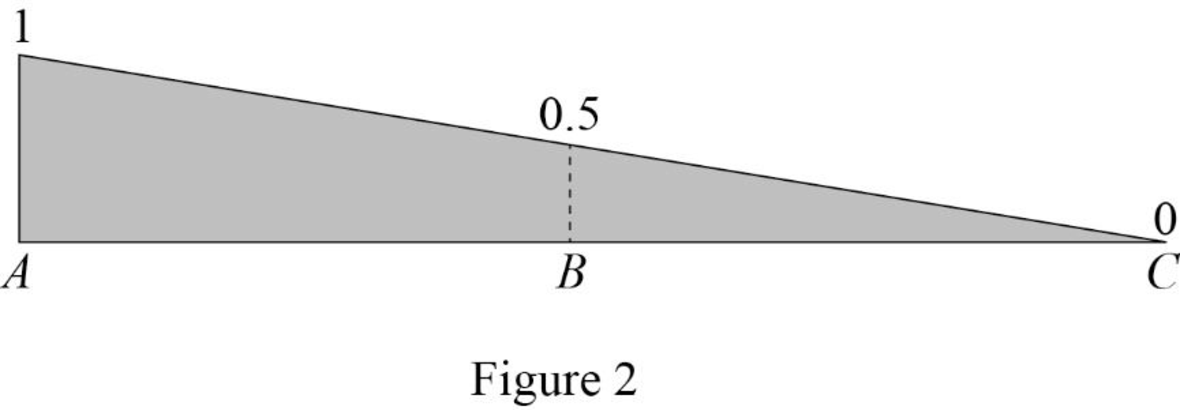
| x | |
| 0 | 1 |
| 15 | 0.5 |
| 30 | 0 |
Draw the influence line diagram for the vertical reactions at support A using Table 1 as shown in Figure 2.
Consider Equation (2).
Find the influence line ordinate of reaction
Substitute 30 for x in Equation (2).
Similarly calculate the influence line ordinate of reaction
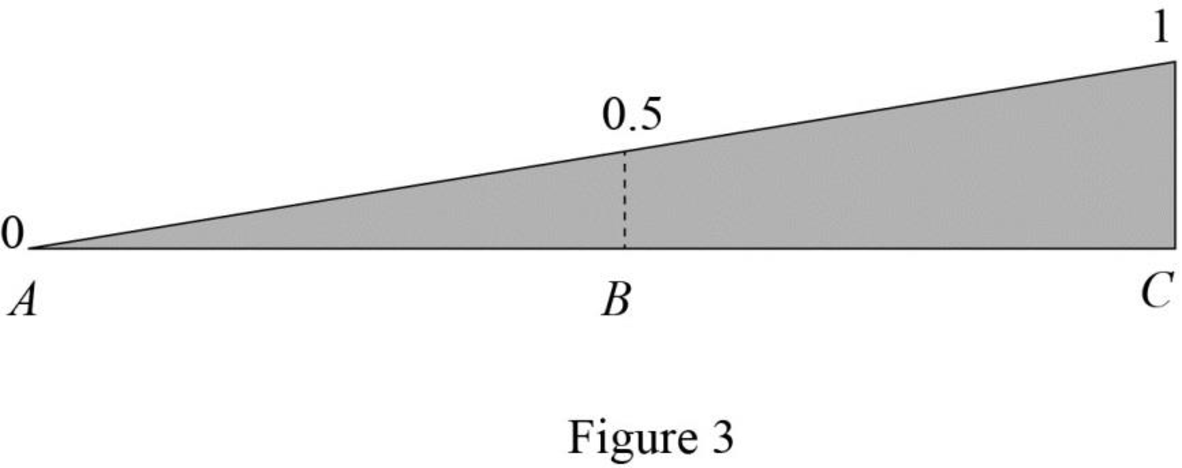
| x | |
| 0 | 0 |
| 15 | 0.5 |
| 30 | 1 |
Draw the influence line diagram for the vertical reactions at support C using Table 2 as shown in Figure 3.
Find the equation of shear force at B of portion AB
Sketch the free body diagram of the section AB as shown in Figure 4.
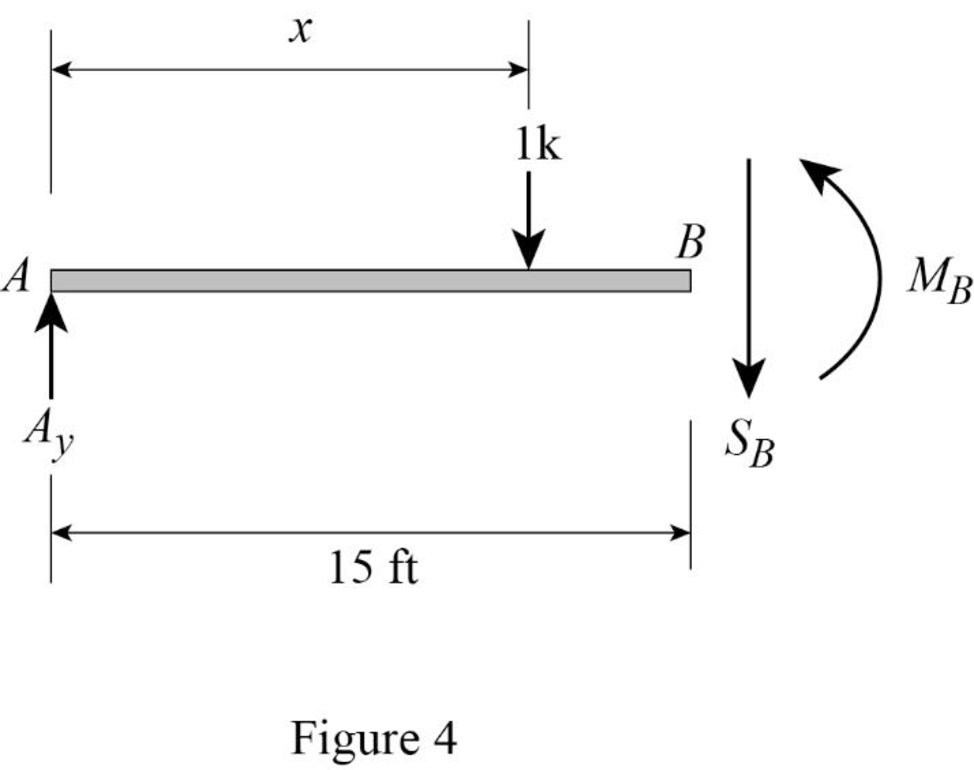
Refer Figure 4.
Apply equilibrium equation of forces.
Consider upward force as positive
Substitute
Find the equation of shear force at B of portion BC
Sketch the free body diagram of the section BC as shown in Figure 5.
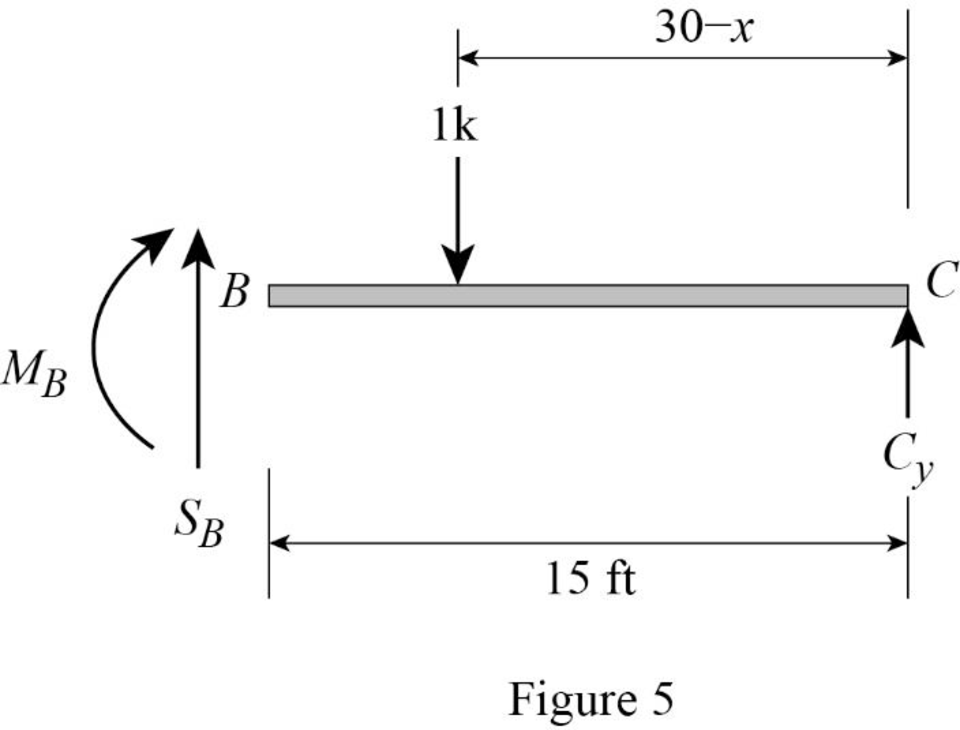
Refer Figure 5.
Apply equilibrium equation of forces.
Consider upward force as positive
Substitute
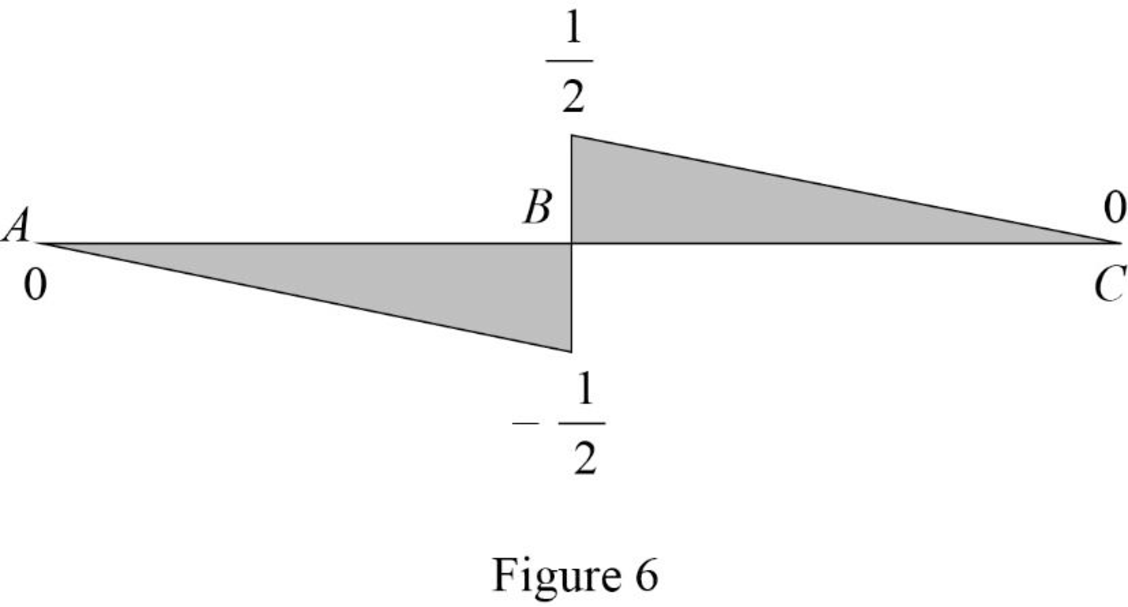
Thus, the equations of the influence line for
Find the value of influence line ordinate of shear force at various points of x using the Equations (3) and (4) and summarize the value as in Table 3.
| x | |
| 0 | 1 |
| 30 | 0 |
Draw the influence lines for the shear force at point B using Table 3 as shown in Figure 6.
Refer Figure 4.
Consider clockwise moment as positive and anticlockwise moment as negative.
Find the equation of moment at B of portion AB
Substitute
Refer Figure 5.
Consider clockwise moment as negative and anticlockwise moment as positive.
Find the equation of moment at B of portion BC
Substitute
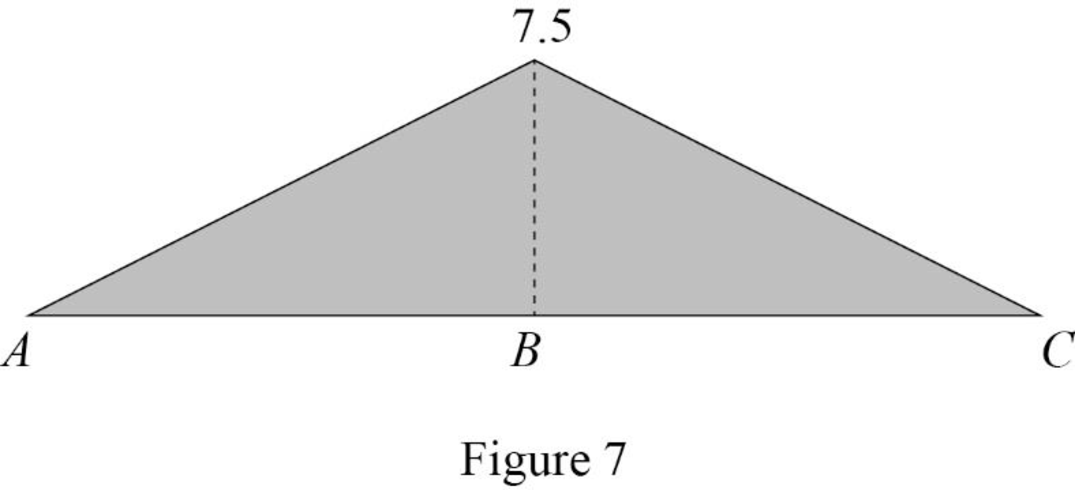
Thus, the equations of the influence line for
Find the value of influence line ordinate of moment at various points of x using the Equations (5) and (6) and summarize the value as in Table 4.
| x | |
| 0 | 0 |
| 30 | 0 |
Draw the influence lines for the moment at point B using Table 4 as shown in Figure 7.
Therefore, the influence lines for the vertical reactions at supports A and C and the influence lines for the shear and bending moment at point B are drawn.
Want to see more full solutions like this?
Chapter 8 Solutions
Structural Analysis

