Concept explainers
a.
To determine: The average
Risk and Return:
The risk and return are two closely related terms. The risk is the uncertainty attached to an event. In case of any investment, there is some amount of risk attached to it as there can be either gain or loss. While return in the financial term is that percentage which represents the profit in an investment.
Higher risk is associated with higher return and lower risk has a probability of lower return. The investor has to face a tradeoff between risk and return in terms of an investment.
Annual Rate of Return:
The annual rate of return refers to that return which is charged or is earned on an investment for a year. This rate is expressed in percentage.
a.
Answer to Problem 22SP

Explanation of Solution
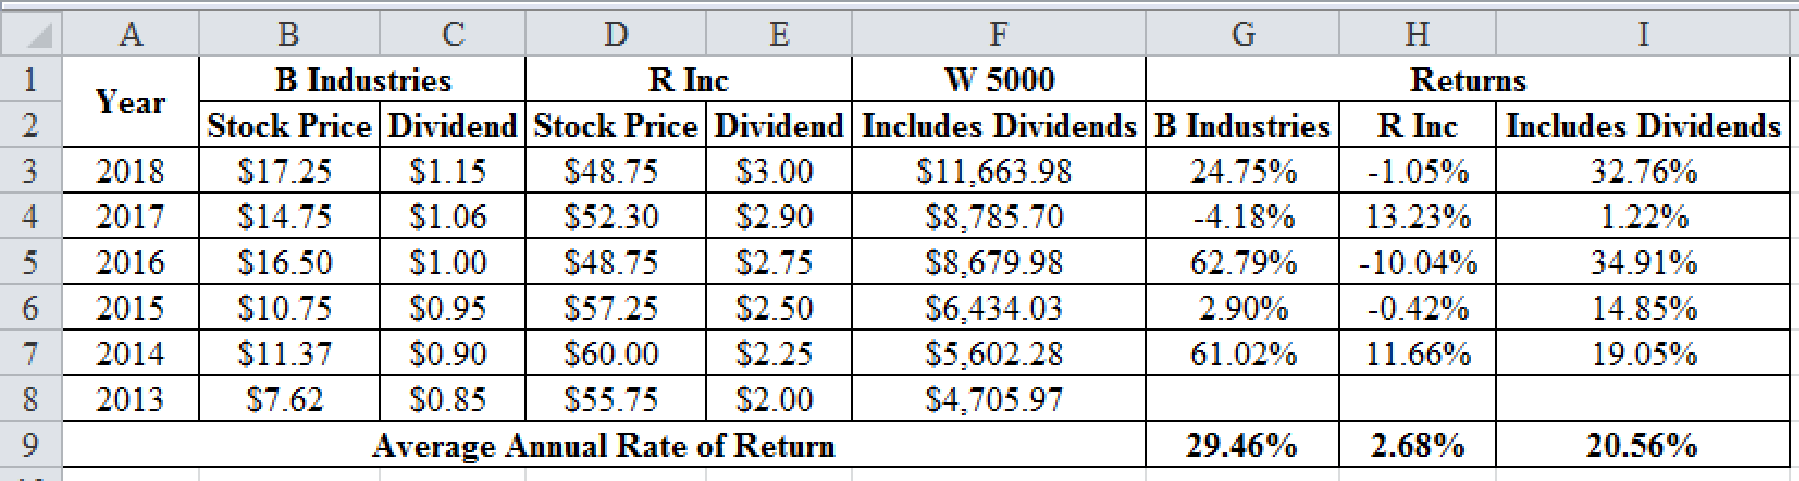
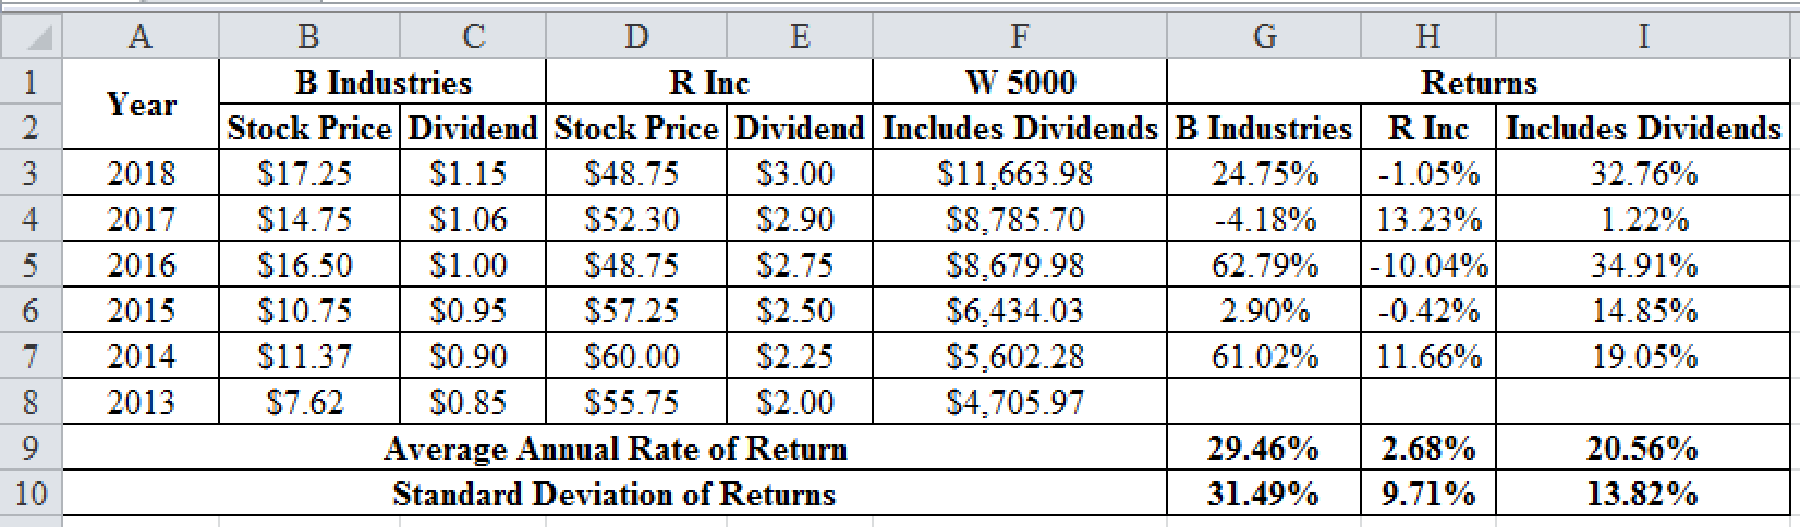
Calculation of annual rates of return in the excel spreadsheet:
Excel Spreadsheet:
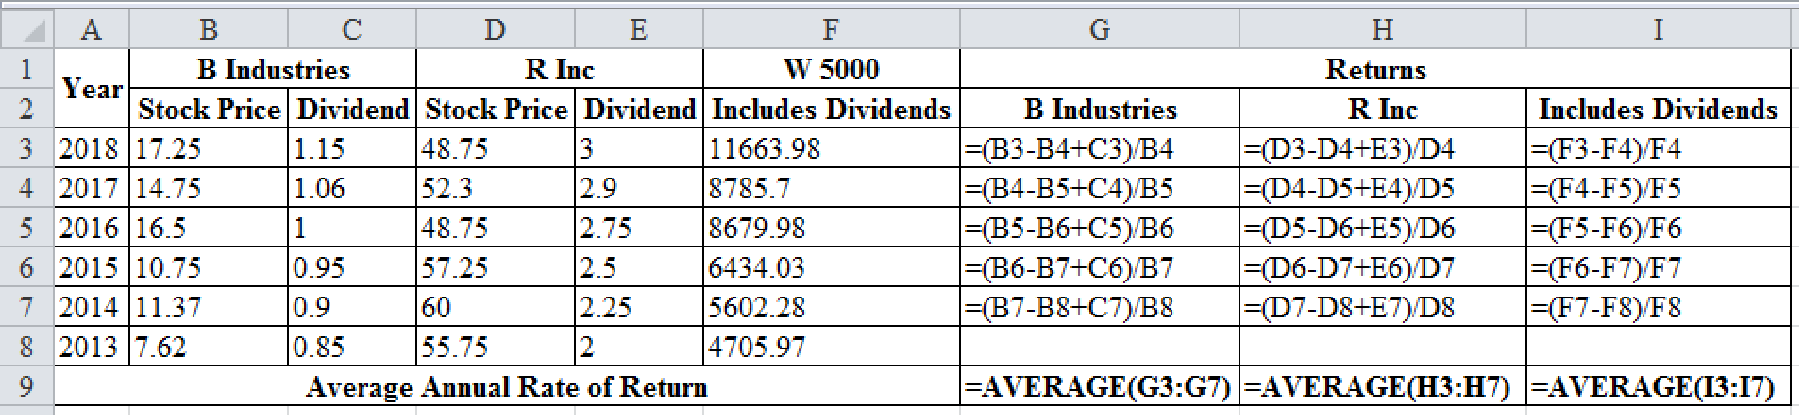
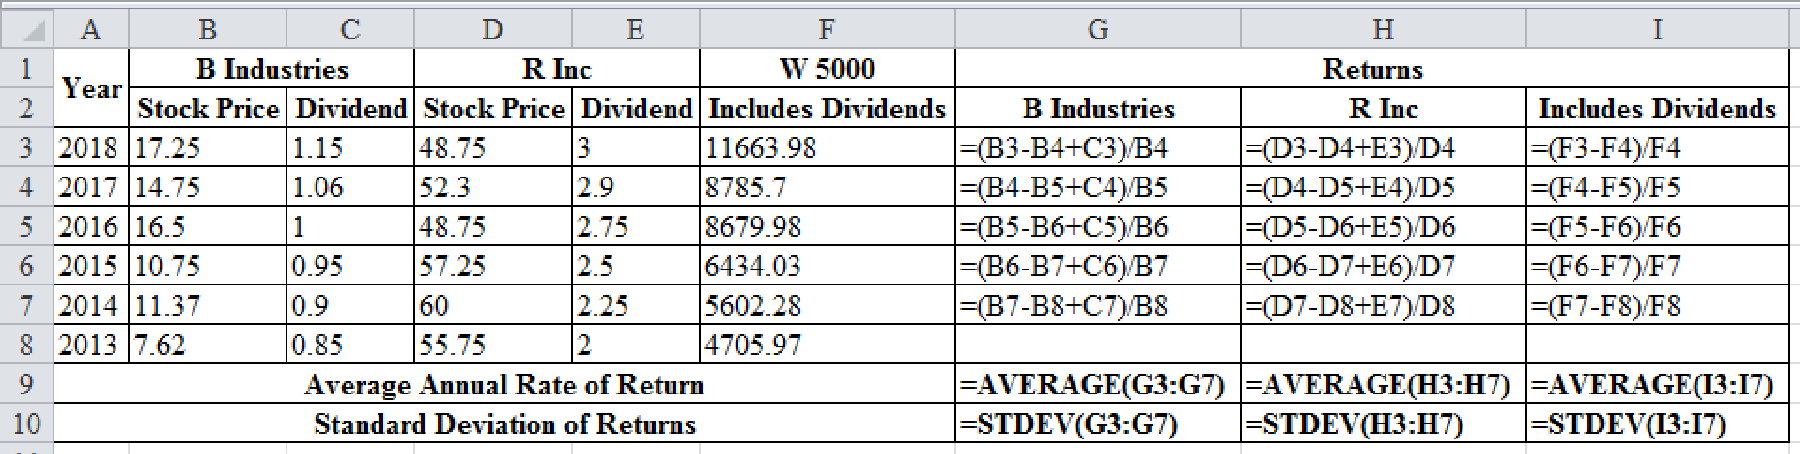
Excel Workings:
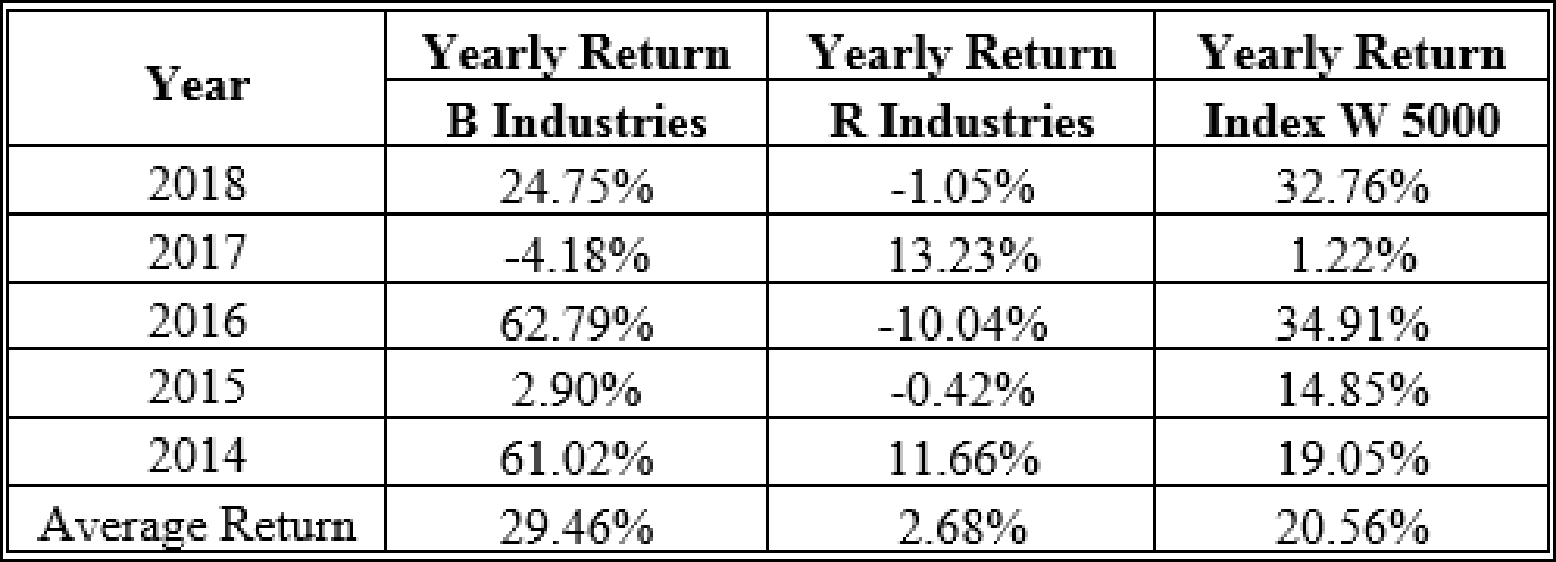
Therefore the yearly returns and average returns are as follows,
b.
To prepare: The standard deviation for the given data.
Standard deviation:
The standard deviation refers to the stand-alone risk associated with the securities. It measures how much a data is dispersed with its standard value. The Greek letter sigma represents the standard deviation.
b.
Answer to Problem 22SP
The standard deviation of B industries is 31.49%, R industries are 9.71% and Index W 5000 is 13.82%.
Explanation of Solution
Calculation of standard deviation with a excel spreadsheet:
Excel Spreadsheet:
Excel Workings:
Therefore the standard deviation of B industries is 31.49%, R industries are 9.71% and Index W 5000 is 13.82%.
c.
To determine: The coefficient of variation.
The coefficient of variation:
The coefficient of variation is a tool to determine the risk. It determines the risk per unit of return. It is used for measurement when the expected returns are same for two data.
c.
Answer to Problem 22SP
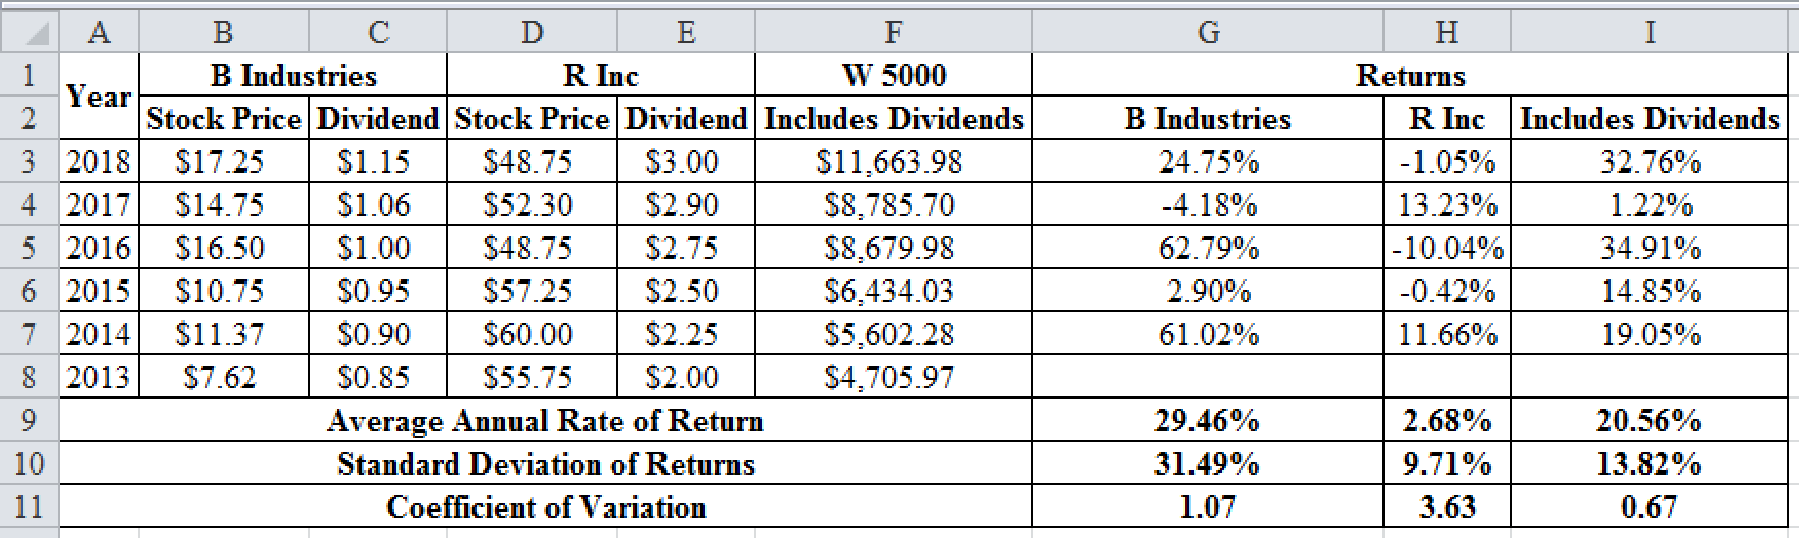
The coefficient of variation of B industries is 1.07, R industries are 3.63 and Index W 5000 is 0.67.
Explanation of Solution
The calculations of the coefficient of variation for the given data is shown below using excel:
Excel Spreadsheet:
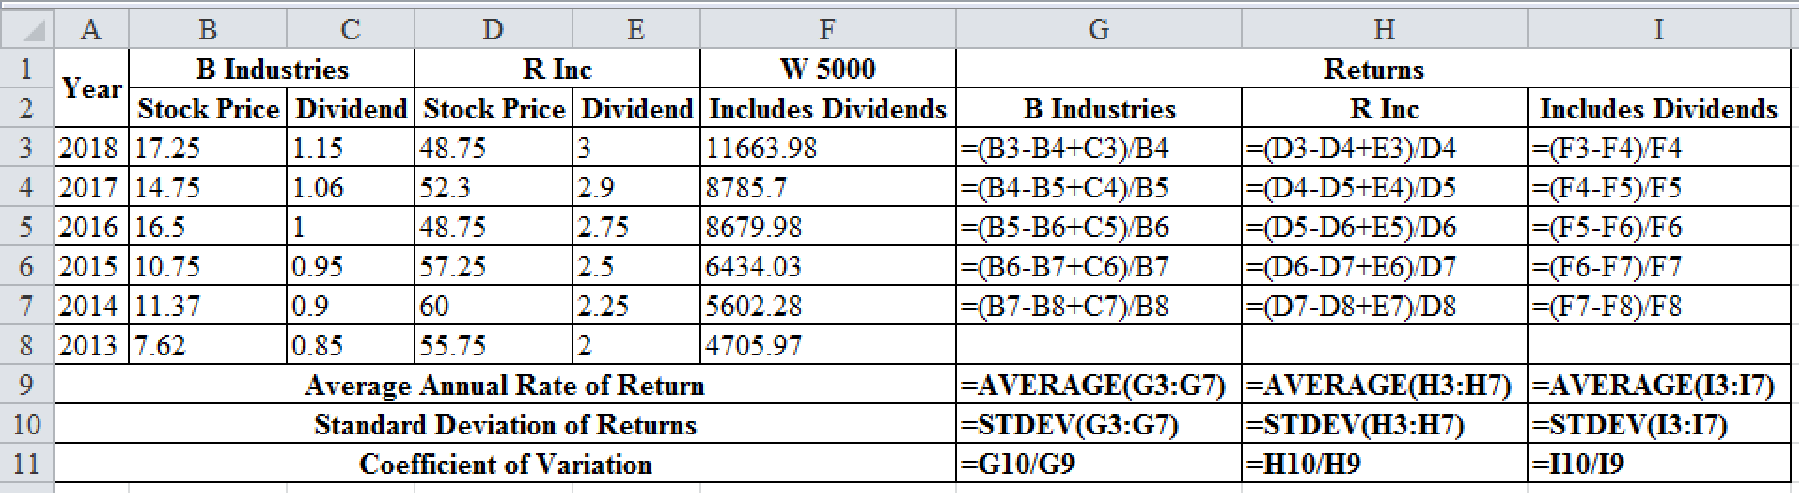
Excel Workings:
Therefore the coefficient of variation of B industries is 1.07, R industries are 3.63 and Index W 5000 is 0.67.
d.
To determine: The Sharpe ratio.
d.
Answer to Problem 22SP
The Sharpe ratio of B industries is 0.84, R industries are -0.03 and Index W 5000 is 1.27.
Explanation of Solution
Calculate the Sharpe Ratio for each company:
Therefore the Sharpe ratio of B industries is 0.84, R industries are -0.03 and Index W 5000 is 1.27.
e.
To prepare: A scatter diagram showing the company’s returns and the index returns.
e.
Explanation of Solution
The scatter diagram is as shown below:
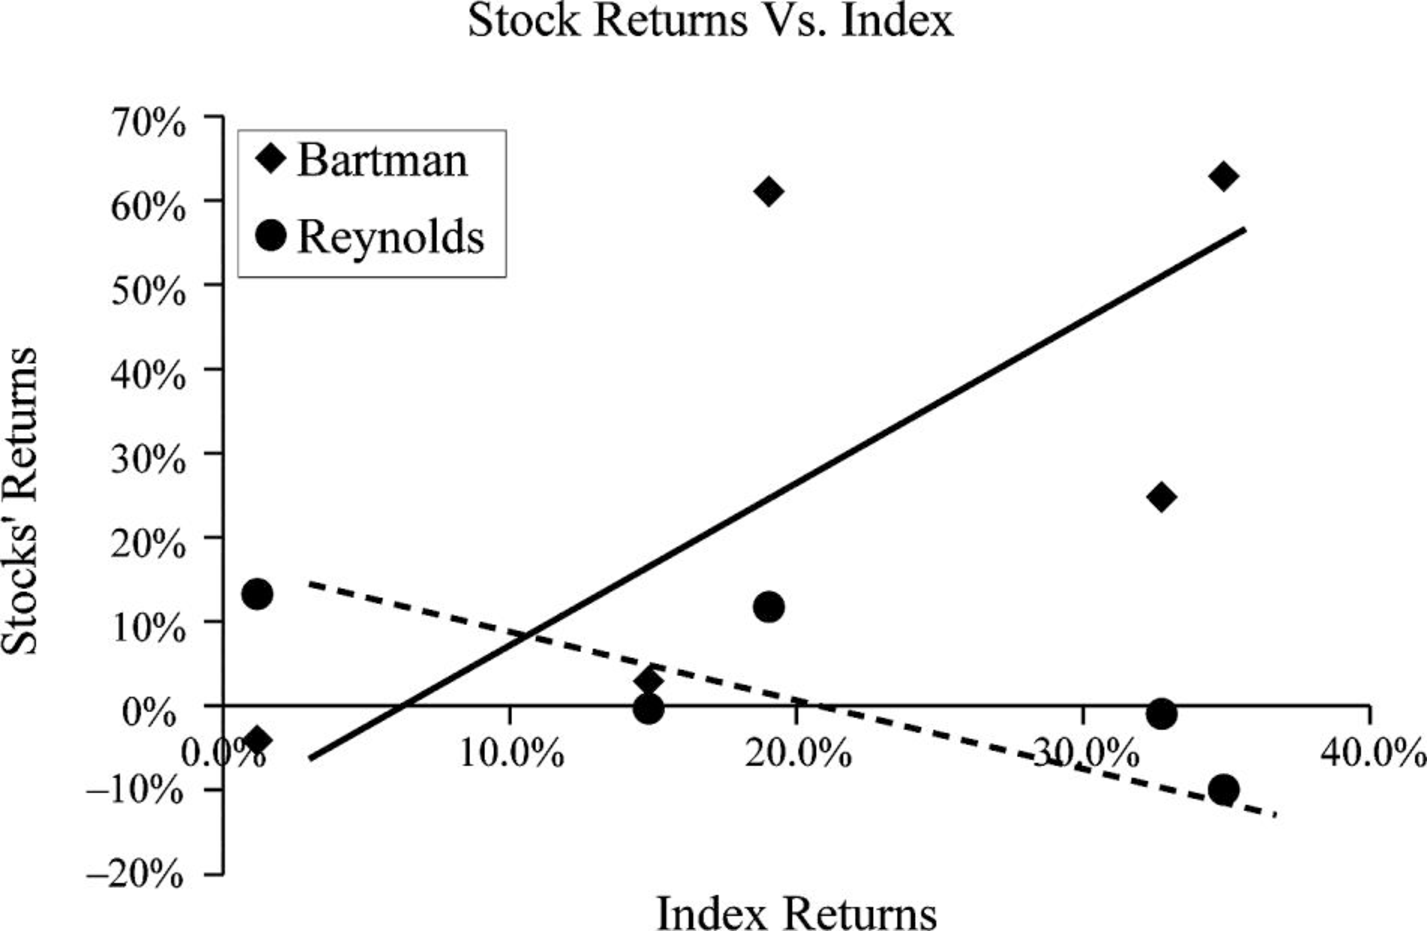
Graph (1)
- The blue line represents the B Industries and the red line represents the R Inc. and green lone represents the Index W 5000.
f.
To determine: The beta of the B Industries and R Inc. by running regressions of their returns.
f.
Answer to Problem 22SP
The beta of B industries is 1.53, R industries are -0.56.
Explanation of Solution
The beta of the B Industries, R Inc. and W 5000 by running regressions of their returns is:
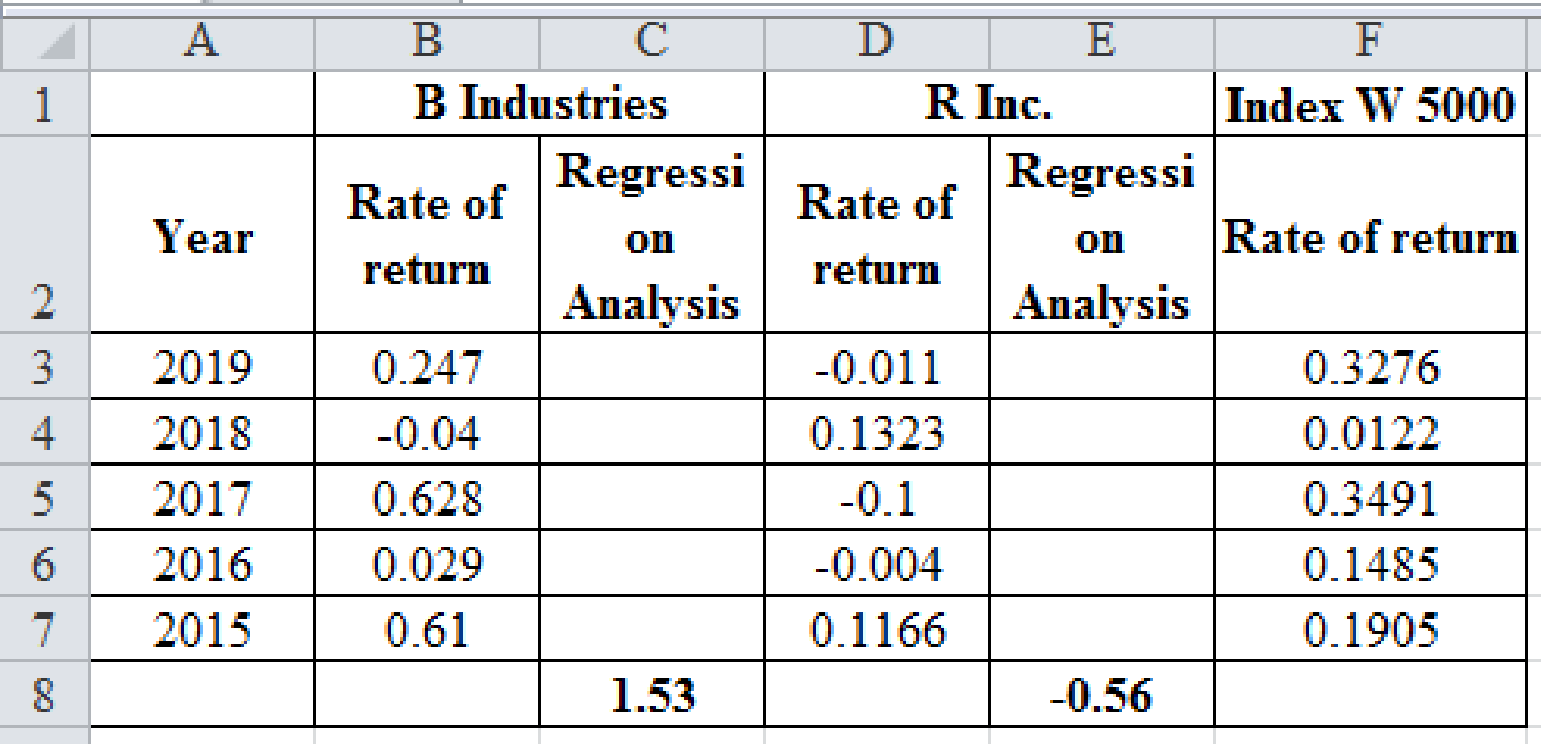
Therefore the beta of B industries is 1.53, R industries are -0.56.
g.
To determine: The required returns of the two companies by security market line equation.
g.
Answer to Problem 22SP
The required return of B industries is 13.67%, R industries are -3.26%.
Explanation of Solution
Given,
The risk-free rate is 4.5%.
The expected return on market is 10%.
Calculation of the required return:
Therefore the required return of B industries is 12.97%, R industries are 1.42%.
h.
To determine: The beta and the required return for a newly constructed portfolio.
h.
Answer to Problem 22SP
The required return of portfolio is 7.20% and the portfolio beta is 0.49.
Explanation of Solution
Calculation of the beta and the required return for the new portfolio:
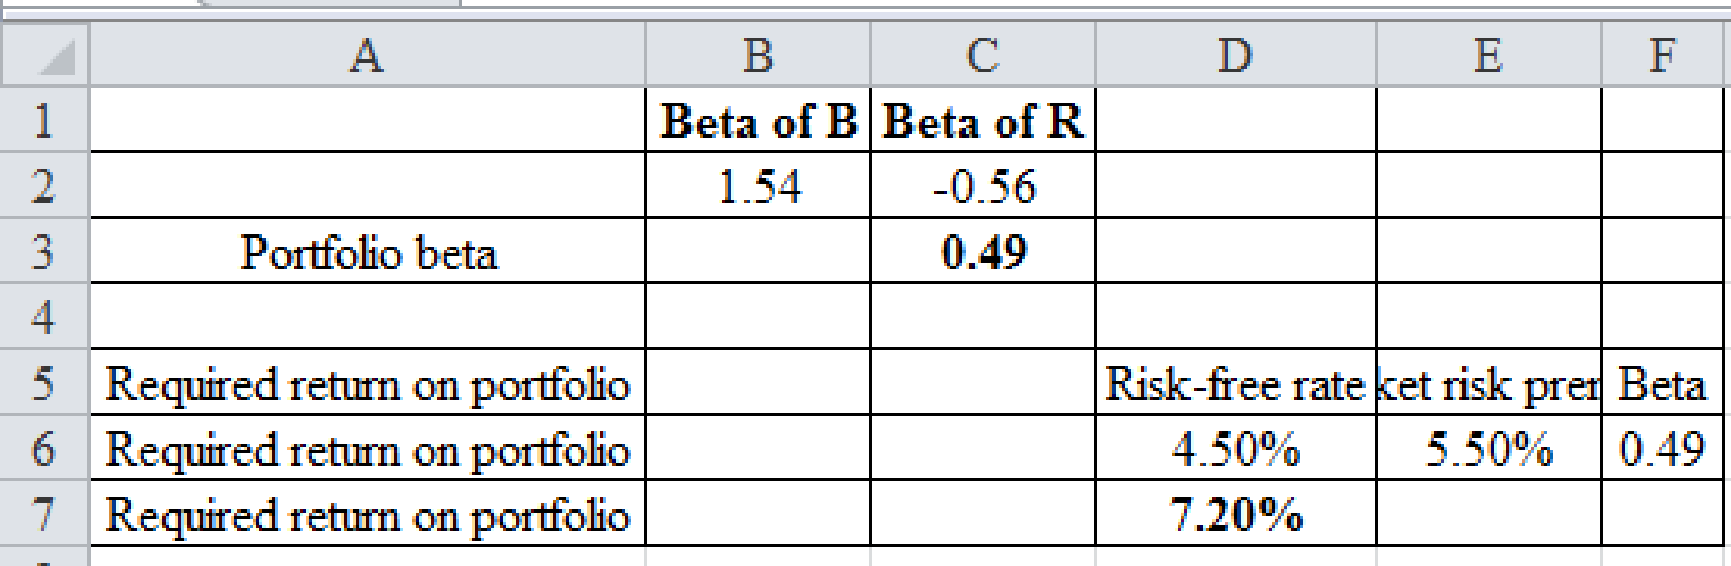
Therefore the required return of portfolio is 7.20% and the portfolio beta is 0.49.
i.
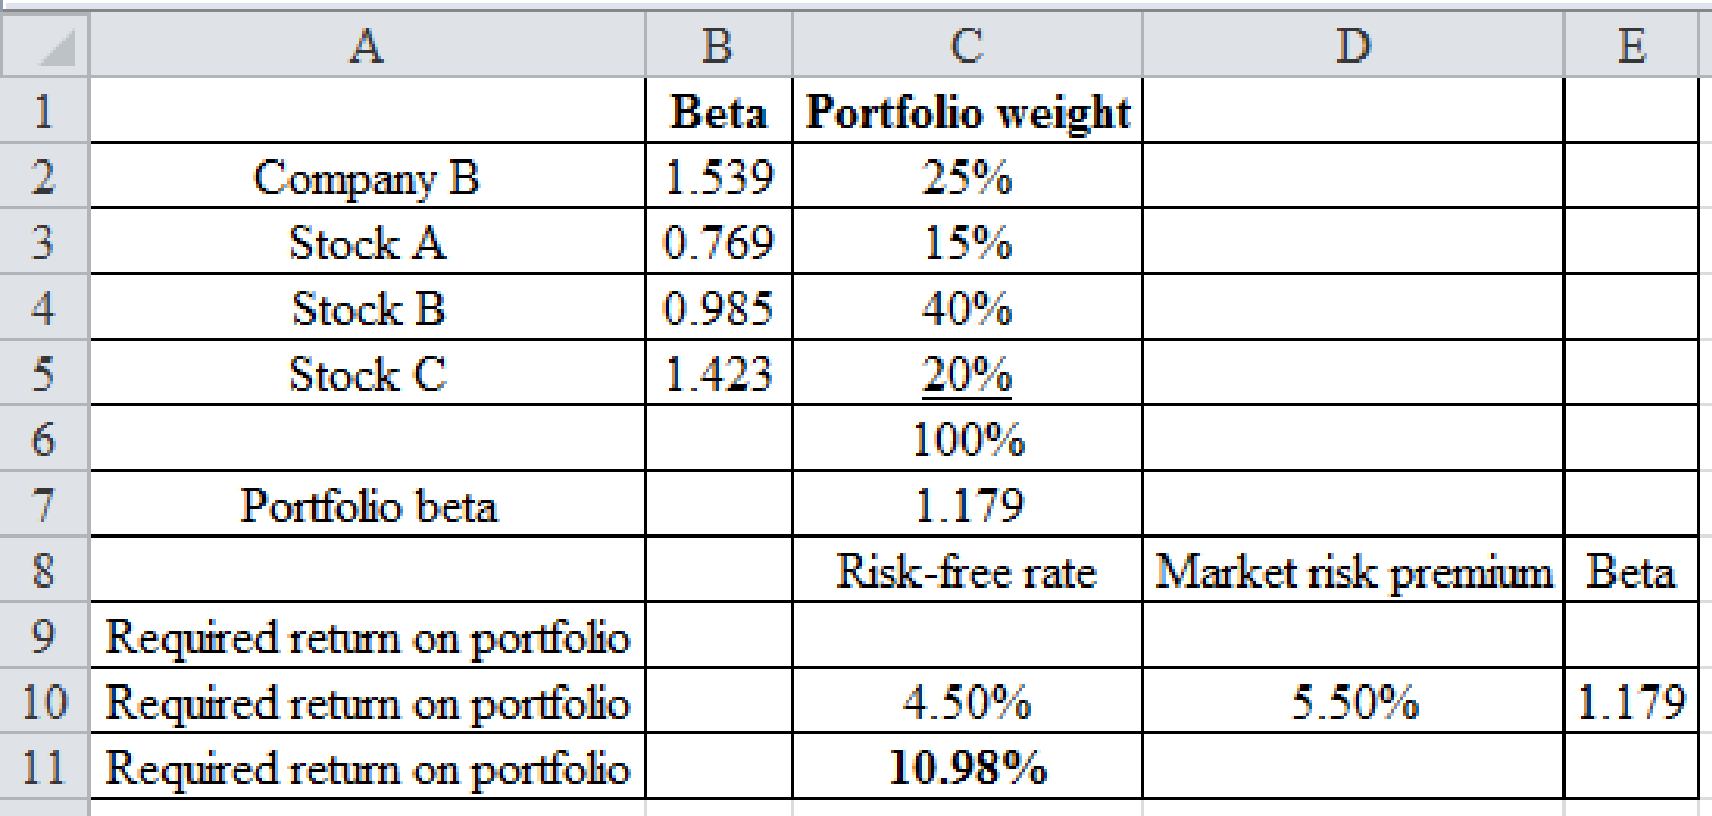
To determine: The new portfolio’s required return.
i.
Answer to Problem 22SP
The new portfolio’s required return is 10.98%.
Explanation of Solution
Calculation of the required return on the portfolio:
Excel Spreadsheet:
Excel Workings:
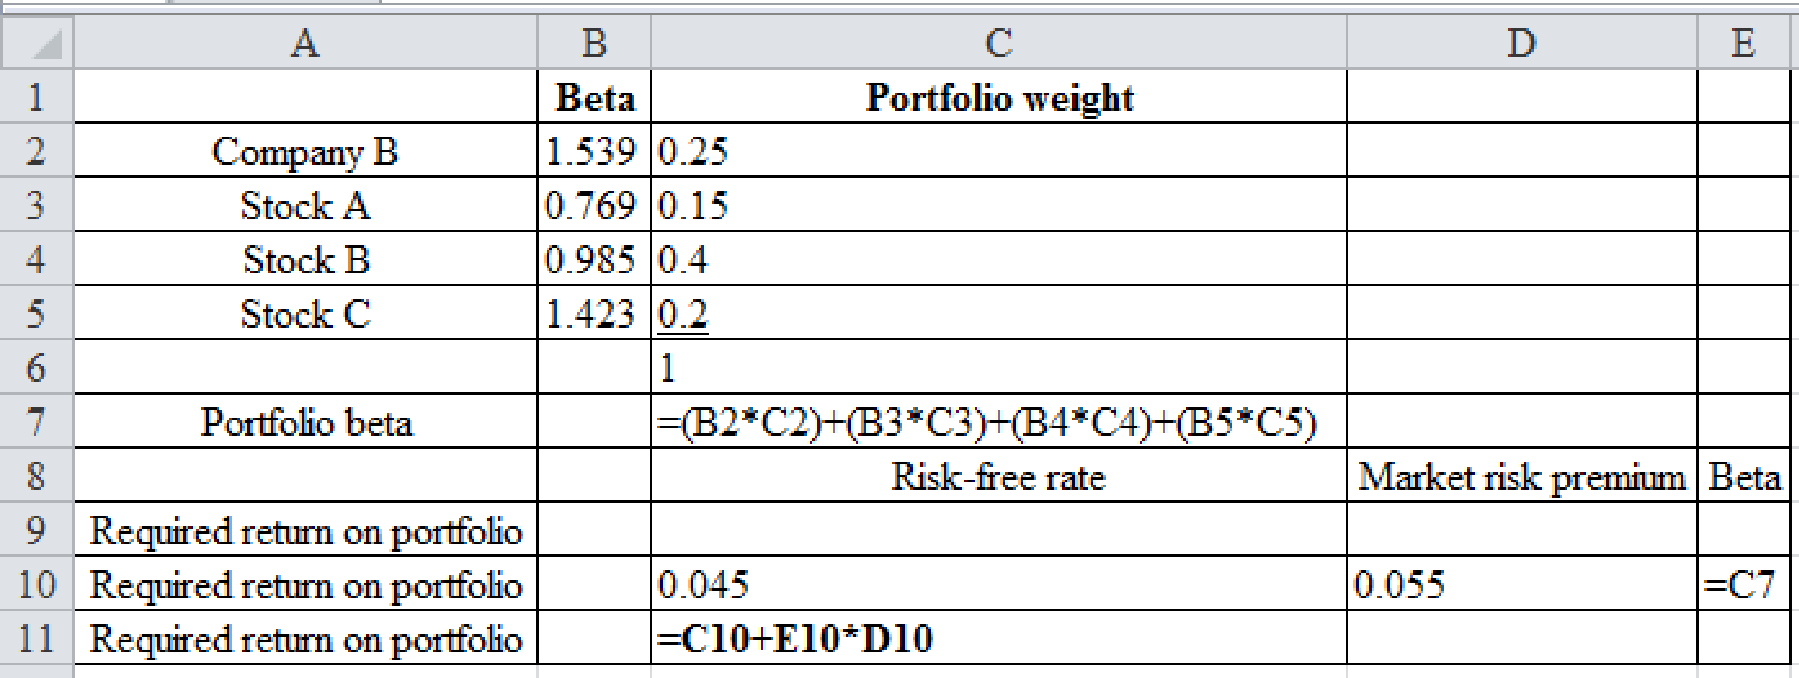
Therefore the new portfolio’s required return is 10.98%.
Want to see more full solutions like this?
Chapter 8 Solutions
Fundamentals Of Financial Management, Concise Edition (mindtap Course List)


- Use the extended DuPont equation to provide a breakdown of Computrons projected return on equity. How does the projection compare with the previous years and with the industrys DuPont equation?arrow_forwardUsing the Value Line Investment Survey report in Exhibit 11.5, find the following information for Apple. What was the amount of revenues (i.e., sales) generated by the company in 2017? What were the latest annual dividends per share and dividend yield? What is the earnings per share (EPS) projection for 2019? How many shares of common stock were outstanding? What were the book value per share and EPS in 2017? How much long-term debt did the company have in the third quarter of 2018?arrow_forwardCALCULATING THE WACC Here is the condensed 2019 balance sheet for Skye Computer Company (in thousands of dollars): Skyes earnings per share last year were 3.20. The common stock sells for 55.00. last years dividend (D0) was 2.10, and a flotation cost of 10% would be required to sell new common stock. Security analysts are projecting that the common dividend will grow at an annual rate of 9%. Skyes preferred stock pays a dividend of 3.30 per share, and its preferred stock sells for 30.00 per share. The firms before-lax cost of debt is 10%, and its marginal tax rate is 25%. The firms currently outstanding 10% annual coupon rate, long-term debt sells at par value. The market risk premium is 5%, the risk-free rate is 6%, and Skyes beta is 1.516. The firms total debt, which is the sum of the companys short-term debt and long-term debt, equals 1.2 million. a. Calculate the cost of each capital component, that is, the after-tax cost of debt, the cost of preferred stock, the cost of equity from retained earnings, and the cost of newly issued common stock. Use the DCF method to find the cost of common equity. b. Now calculate the cost of common equity from retained earnings, using the CAPM method. c. What is the cost of new common stock based on the CAPM? (Hint: Find the difference between r1 and rs as determined by the DCF method, and add that differential to the CAPM value for rs.) d. If Skye continues to use the same market-value capital structure, what is the firms WACC assuming that (1) it uses only retained earnings for equity and (2) if it expands so rapidly that it must issue new common stock?arrow_forward
 Fundamentals of Financial Management (MindTap Cou...FinanceISBN:9781285867977Author:Eugene F. Brigham, Joel F. HoustonPublisher:Cengage Learning
 Fundamentals of Financial Management, Concise Edi...FinanceISBN:9781285065137Author:Eugene F. Brigham, Joel F. HoustonPublisher:Cengage Learning
 Fundamentals of Financial Management, Concise Edi...FinanceISBN:9781305635937Author:Eugene F. Brigham, Joel F. HoustonPublisher:Cengage Learning
 Fundamentals Of Financial Management, Concise Edi...FinanceISBN:9781337902571Author:Eugene F. Brigham, Joel F. HoustonPublisher:Cengage Learning
 Fundamentals of Financial Management (MindTap Cou...FinanceISBN:9781337395250Author:Eugene F. Brigham, Joel F. HoustonPublisher:Cengage Learning
 Managerial AccountingAccountingISBN:9781337912020Author:Carl Warren, Ph.d. Cma William B. TaylerPublisher:South-Western College Pub