a)1.
To discuss: The reason for Treasury bill’s return is independent of the state of the economy.
Introduction:
Risk and Return are two closely related terms. The risk is the uncertainty attached to an event. In case of any investment, there is some amount of risk attached to it as there can be either gain or loss. While return in the financial term is that percentage which represents the profit in an investment. Higher risk is related to higher return and lower risk has a probability of lower return. The investor has to face a tradeoff between risk and return in terms of an investment.
Treasury bills are those short-term bonds or securities which have maturity period of less than one year. These are issued by the government for a shorter period and when the government needs to raise funds immediately.
a)1.
Explanation of Solution
The Treasury-bills will not depend on the economic condition as the treasury bills must and will redeem at par irrespective of the economic state.
2.
To explain: The reason for H’s returns expected to move with the economy and C’s returns expected to move counter to the economy.
2.
Explanation of Solution
- There are two kinds of correlation one is positive correlation and other is a negative correlation.
- When return is correlated positively, they will move with the economy and when they are correlated negatively, they move counter the economy.
- The H’s returns are positively correlated with the economy, as the sales of the firm and its profits will experience the same kind of fluctuations as will the economy.
- The C Company is considered by most of the investors as a hedge against both high inflation and bad times, so in case the stock crashes the investors will do well relatively.
- There are two kinds of correlation one is positive correlation and other is a negative correlation.
- When return is correlated positively, they will move with the economy and when they are correlated negatively, they move counter the economy.
b)
To determine: The expected
The expected Return on the stock refers to the weighted average of expected
b)
Explanation of Solution
Given information:
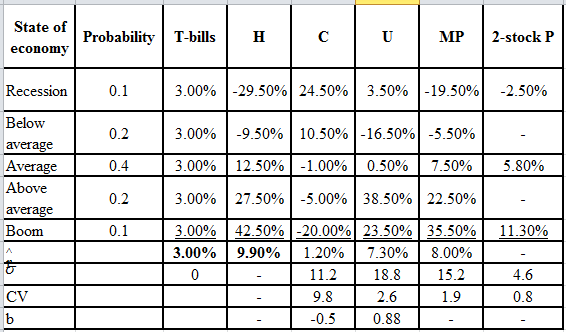
Refer table in integrated case 8-23 for the details of returns on alternative investments.
The formula to calculate the expected rate of return:
Where,
- N is the number of states of the economy.
Calculate the expected rate of return for H Company:
Hence, the expected rate of return is 9.9%.
Calculate the expected rate of return for T-bills:
Hence, the expected rate of return is 3%.
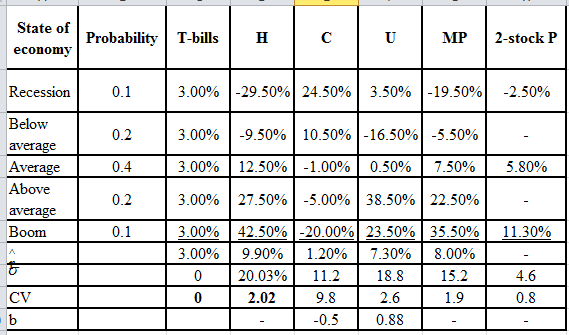
The value filled in the table is as follows:
c)1.
To determine: The standard deviation of returns.
Standard Deviation refers to the stand-alone risk associated with the securities. It measures how much a data is dispersed with its standard value. The Greek letter sigma represents the standard deviation.
c)1.
Explanation of Solution
Given information:
Refer table in integrated case 8-23 for the details of returns on alternative investments.
The formula to calculate the standard deviation:
Where,
- N is the number of states.
Calculate the standard deviation for H:
Hence, the standard deviation for H company is 20.03%.
The value of
2.
To explain: The type of risk measured by the standard deviation.
2.
Answer to Problem 23IC
The stand-alone risk of a portfolio is measured by the standard deviation.
Explanation of Solution
- The standard deviation is a measure of the risk of a security.
- The greater is the standard deviation, the higher is the chance that actual returns will be below the expected return.
- It also shows that there will be losses rather than profits.
3.
To prepare: A graph showing the probability distribution for H Company, U rubber company, and T-bills.
3.
Explanation of Solution
Given information:
Refer part b) for the rate of return of H Company, U Rubber Company, and T-bills.
Graphical representation:
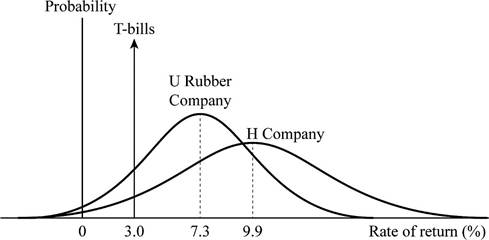
- The graph shows the probability distribution for the given companies.
- The X-axis shows the rate of return in percentage.
- The Y-axis shows the occurrence.
- On the basis of the graph, the H is the riskiest investment.
- The T has the less risky investment.
d)
To determine: The missing values of coefficient of variation and comparison of risk rankings of the coefficient of variation with the standard deviation.
The coefficient of variation is a tool to determine the risk. It determines the risk per unit of return. It is used for measurement when the expected returns are same for two data.
d)
Explanation of Solution
Given information:
For T-bills,
The standard deviation is 0.0%.
The expected rate of return is 3%.
For H,
The standard deviation is 20.03%.
The expected rate of return is 9.9%.
The formula to calculate the coefficient of variation:
Calculate the coefficient of variation for T-bills:
Hence, the coefficients of variation for T-bills are 0.
Calculate coefficient of variation for H Company:
Hence, the coefficient of variation for H Company is 2.02.
The table with the missing values is as follows:
f)1.
To determine: The expected return on stock, standard deviation, coefficient of variation, and the Sharpe ratio and fill the missing values in the table.
f)1.
Explanation of Solution
Given information:
A 2-stock portfolio is created. The investment in H is $50,000 and investment in C is $50,000.
The formula to calculate the expected rate of return:
Where,
The formula to calculate the Sharpe ratio:
The formula to calculate the expected rate of return:
Where,
- N is the number of states of the economy.
Calculate the expected rate of return for recession:
Hence, the expected rate of return is -2.5%.
Note: Use the same formula and calculations to find the expected rate of return for all states of economy.
Calculate the risk free rate:
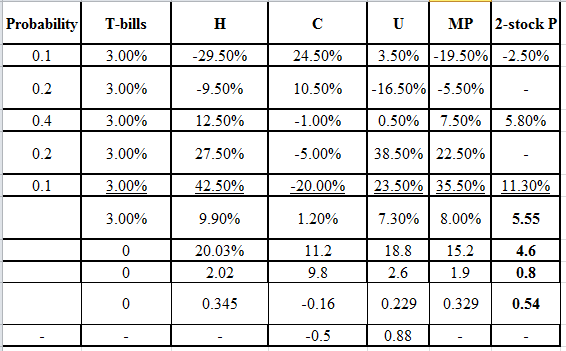
Hence, the expected rate of return is 5.55%.
Note: Use the same formula and calculations for the expected rate of return of other states of economy.
Expected rate of return of other states of economy:
| State | Portfolio |
| Recession | -2.50% |
| Below average | 0.50% |
| Average | 5.80% |
| Above average | 11.30% |
| Boom | 11.30% |
The formula to calculate the standard deviation:
Calculate the standard deviation for the 2-stock portfolio:
Hence, the standard deviation is 4.62.
Compute the Sharpe ratio:
Hence, the Sharpe ratio is 0.541.
The table with the missing values is as follows:
2)
To explain: The comparison of the riskiness of the 2-stock portfolios with the riskiness of the individual stock.
2)
Explanation of Solution
The comparison of the riskiness of the 2-stock portfolio with the riskiness of the individual stock is explained below:
Using standard deviation or coefficient of variance as the measure of stand-alone risk, the stand-alone risk of the portfolio is significantly less than the stand-alone risk of the individual stocks. This is because the stocks are negatively correlated.
That is if when one company is doing badly and the other is doing well and vice-versa.
During the stock in isolation, the combination of the two stocks diversifies the inherent risks.
- A single stock selected at random would have a standard deviation of about 35%.
g)1
To explain: The effect on riskiness and to the expected return of the portfolio.
g)1
Explanation of Solution
Given information:
The investor begins with a portfolio that has one randomly selected stock.
The effect on riskiness and to the expected return of the portfolio is as follows:
- There is a positive correlation of stocks with one another if the economy does well, and so is the effect on general stocks and vice-versa.
- When the additional stocks are added to the portfolio, the portfolio’s standard deviation declines because the added stocks are not perfectly and positively correlated.
- As more and more stocks are added, the new stock has the impact of less of a risk-reducing, and the addition of the stocks will not have any effects on the portfolio’s risk which is measured by the standard deviation.
- The correlation coefficient between the stocks generally ranges in +0.35. A single stock selected at random would have a standard deviation of about 35%.
- The addition of additional shares to the portfolio decreases the standard deviation of the portfolio as all the stocks are not positively correlated.
- The standard deviation stabilizes at about 20% when 40 or more randomly selected stocks are added.
- Thus, the risk will reduce by one half when the stocks are randomly added.
2.
To explain: The implication for investors.
2.
Explanation of Solution
The investor has to holds well-diversified portfolios of stocks than individual stocks. This can help to reduce the half of the riskiness in the individual stocks.
h)1.
To explain: The impact of the portfolio on the thinking of the investors.
h)1.
Explanation of Solution
The diversification of the portfolio do not affects the investor’s view towards risk. The stand-alone risk which is measured by standard deviation and coefficient of variation and Sharpe ratio may be significant to the undiversified investor but is not appropriate to a well-diversified investor.
A rational, risk-averse investor is more interested in the effect that the stock has on the riskiness of the portfolio than the stand-alone risk of the stock. A rational, risk-averse investor is more interested in the effect that the stock has on the riskiness of the portfolio than the stand-alone risk of the stock.
The stand-alone risk is composed of diversifiable risk, which can be removed by holding a stock in a well-diversified portfolio.
2.
To discuss: The possibilities of compensating the risk and to earning a risk premium which has been eliminated through diversifying.
2.
Explanation of Solution
- When a person holds a one-stock portfolio, the person or the investor is exposed to a higher degree of risk and that risk will not be compensated.
- If the returns are high enough for the compensation of higher risk, the bargain would be more rational for the diversified investors. This will make the price up and returns down.
- So, the possibility of earning a risk premium is not easy and the compensation will not be done for the higher risk.
i)1.
To determine: The beta coefficient and the use of beta for the risk analysis.
i)1.
Explanation of Solution
The beta coefficient and the use of beta for the risk analysis:
A graphical representation helps to know the beta coefficient better. Construct a graph with 45 degree line and plot the points and connect them. Through this the slope is determined as
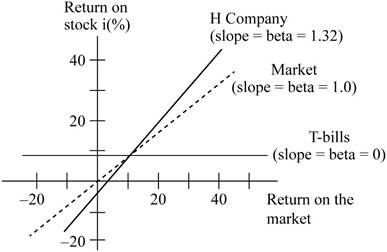
- The graph represents the calculation of the value of the beta.
- The X-axis represents the return on the market.
- The Y-axis represents the return on the stock.
The average stock moves with the market. The value of the beta is calculated as the slope of the regression line which shows the relationship between the given stock and the general stock market. The slopes should be estimated and the slope should be used to calculate the value of beta.
2.
To explain: Whether the expected return is related to each alternative’s market risk.
2.
Explanation of Solution
The expected returns are associated to each alternative’s market risk. This means that higher is the alternative’s rate of return, higher is the beta. The treasury bills also have zero risks.
3.
To discuss: Whether it is possible to select among the different alternatives on the information developed so far.
3.
Explanation of Solution
- No, it is not possible to select among the alternatives on the basis of the information which is developed so far.
- The required rates of return are needed on these alternatives and then a comparison of them with their expected returns is needed.
j)1.
To determine: The security-market line equation (SML), the calculation of the required rate of return on every alternative and the graph showing the relationship between the expected and required rates of return.
j)1.
Explanation of Solution
Given information:
The long-term Treasury bonds have a 3.0% yield.
The assumed risk-free rate is 3.0%.
The security market line equation:
Where,
The risk-free rate is 3.0%.
The market return rate is 8.0%.
So, the market risk premium is 5%
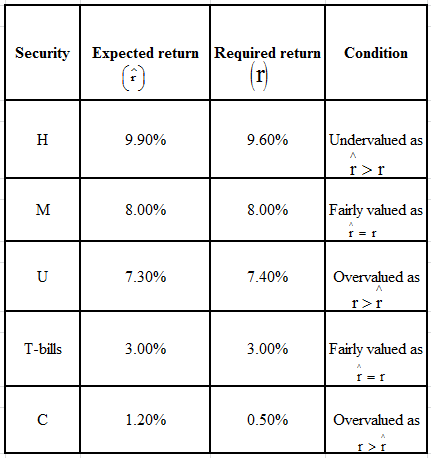
Calculate the required rate of return for H Company:
Hence, the required rate of return is 9.6%.
Calculate the required rate of return for Market portfolio:
Hence, the required rate of return is 8%.
Calculate the required rate of return for U Rubber Company:
Hence, the required rate of return is 7.4%.
Calculate the required rate of return for T-bills:
Hence, the required rate of return is 3%.
Calculate the required rate of return for C Company:
Hence, the required rate of return is − 0.5%.
Graphical representation:
The graph showing the relationship between expected return and required rate of return:
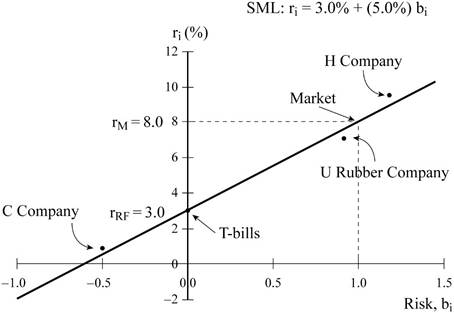
- The graph shows the relationship between the required rate and expected return.
- The X-axis shows the value of beta.
- The Y-axis shows the required and expected rates of return.
- The slope shows the security market line equation.
- The X-axis is extended to the left of zero. This shows that there is a negative beta stock and the required return is less than the risk-free rate.
2.
To determine: The comparison between the expected rates of return and the required rate of return.
2.
Explanation of Solution
Comparison between the expected rates of return and the required rate of return:
3.
To explain: Whether it is sensible that C Company has an expected return less than T-bills.
3.
Explanation of Solution
- The C Company has a negative beta value which indicates that there is a negative market risk. The inclusion of the stock of C Company in a normal portfolio will lower the risk of the portfolio. Thus, the required rate of return is below the risk free rate. This means that C Company is a valuable security to rational, well-diversified investors.
- The C Company has an expected return less than T-bills have a sense that the stock C Company will affect the normal portfolio more than T-bills. The example is a fire insurance policy or life insurance policy. The fire insurance policies have a negative expected return and this is because of commissions and insurance company profits. A stock having negative beta is similar to an insurance policy.
4.
To determine: The market risk and the required return of a 50-50 portfolio of H Company and C Company
4.
Explanation of Solution
Given information:
The risk-free rate is 3%.
The market return is 8.0%.
Refer part i) for the beta values
Calculate the required return on the 50-50 portfolio of H Company and C Company.
The formula to calculate the required rate of return:
Where,
Calculate the beta for 50-50 portfolio of H Company and C Company:
Hence, the value of beta is 0.405.
Calculate the required rate of return of H Company:
Hence, the required rate of return is 5.025%.
k)1.
To determine: The effect of the higher inflation on the security market line and on the returns required on high and low-risk securities, if the investors raises the expectation of inflation by 3%.
k)1.
Explanation of Solution
Graphical representation:
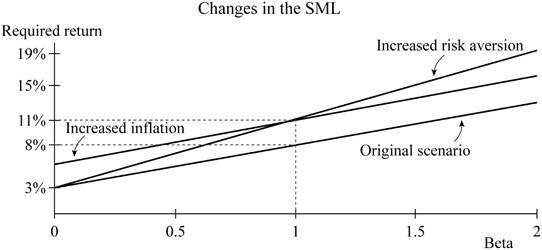
- The graph shows the effect of higher inflation on the security market line.
- The X-axis shows the value of the beta.
- The Y-axis shows the required and expected rates of return.
Effects:
The graph is plotted the SML ranging from 0 to 20. The base case is based on the
Then the
2.
To determine: The effect of the higher market risk premium on the security market line and on the returns required on high and low-risk securities when the investors risk aversion increases and make the market risk premium to increase by 3%.
2.
Explanation of Solution
Effects:
The risk-free rate is 3% and the market return is 8%.With the increase, the security market line rotates upward about the Y-intercept. The risk-free remains constant at 3% this leads the market rate of return increases to 11% and the risk premium increase to 8%. The required return will increase sharply on high-risk stocks but not much on the securities of low beta
Want to see more full solutions like this?
Chapter 8 Solutions
Fundamentals Of Financial Management, Concise Edition (mindtap Course List)

- Consider the following thoughts of a manager at the end of the companys third quarter: If I can increase my reported profit by 2 million, the actual earnings per share will exceed analysts expectations, and stock prices will increase. The stock options that I am holding will become more valuable. The extra income will also make me eligible to receive a significant bonus. With a son headed to college, it would be good if I could cash in some of these options to help pay his expenses. However, my vice president of finance indicates that such an increase is unlikely. The projected profit for the fourth quarter will just about meet the expected earnings per share. There may be ways, though, that I can achieve the desired outcome. First, I can instruct all divisional managers that their preventive maintenance budgets are reduced by 25 percent for the fourth quarter. That should reduce maintenance expenses by approximately 1 million. Second, I can increase the estimated life of the existing equipment, producing a reduction of depreciation by another 500,000. Third, I can reduce the salary increases for those being promoted by 50 percent. And that should easily put us over the needed increase of 2 million. Required: Comment on the ethical content of the earnings management being considered by the manager. Is there an ethical dilemma? What is the right choice for the manager to make? Is there any way to redesign the accounting reporting system to discourage the type of behavior the manager is contemplating?arrow_forwardYou are evaluating the potential purchase of a small business currently generating $ 42,500 of after-tax cashflow. On the basis of a review of similar risk investment opportunities, you must earn 15% rate of return on the proposed purchase. Because you are relatively uncertain about future cash flows, you decide to estimate the firm’s value using several assumptions about the growth rate of cash flows. What is the firm’s value if cash flows are expected to grow at an annual rate 12% for the first 2 years, followed by a constant rate of 9% from year 3 to infinity?arrow_forwardFormulate a system of equations for the situation below and solve. A private investment club has $600,000 earmarked for investment in stocks. To arrive at an acceptable overall level of risk, the stocks that management is considering have been classified into three categories: high-risk, medium-risk, and low-risk. Management estimates that high-risk stocks will have a rate of return of 15%/year; medium-risk stocks, 10%/year; and low-risk stocks, 6%/year. The members have decided that the investment in low-risk stocks should be equal to the sum of the investments in the stocks of the other two categories. Determine how much the club should invest in each type of stock if the investment goal is to have a return of $60,000/year on the total investment. (Assume that all the money available for investment is invested.) high-risk stocks$ medium-risk stocks$ low-risk stocks$arrow_forward

 Cornerstones of Cost Management (Cornerstones Ser...AccountingISBN:9781305970663Author:Don R. Hansen, Maryanne M. MowenPublisher:Cengage Learning
 Fundamentals of Financial Management, Concise Edi...FinanceISBN:9781305635937Author:Eugene F. Brigham, Joel F. HoustonPublisher:Cengage Learning
 Fundamentals of Financial Management (MindTap Cou...FinanceISBN:9781285867977Author:Eugene F. Brigham, Joel F. HoustonPublisher:Cengage Learning
 Fundamentals of Financial Management, Concise Edi...FinanceISBN:9781285065137Author:Eugene F. Brigham, Joel F. HoustonPublisher:Cengage Learning