
Fundamentals of Financial Management, Concise Edition (with Thomson ONE - Business School Edition, 1 term (6 months) Printed Access Card) (MindTap Course List)
8th Edition
ISBN: 9781285065137
Author: Eugene F. Brigham, Joel F. Houston
Publisher: Cengage Learning
expand_more
expand_more
format_list_bulleted
Videos
Textbook Question
Chapter 8, Problem 4DQ
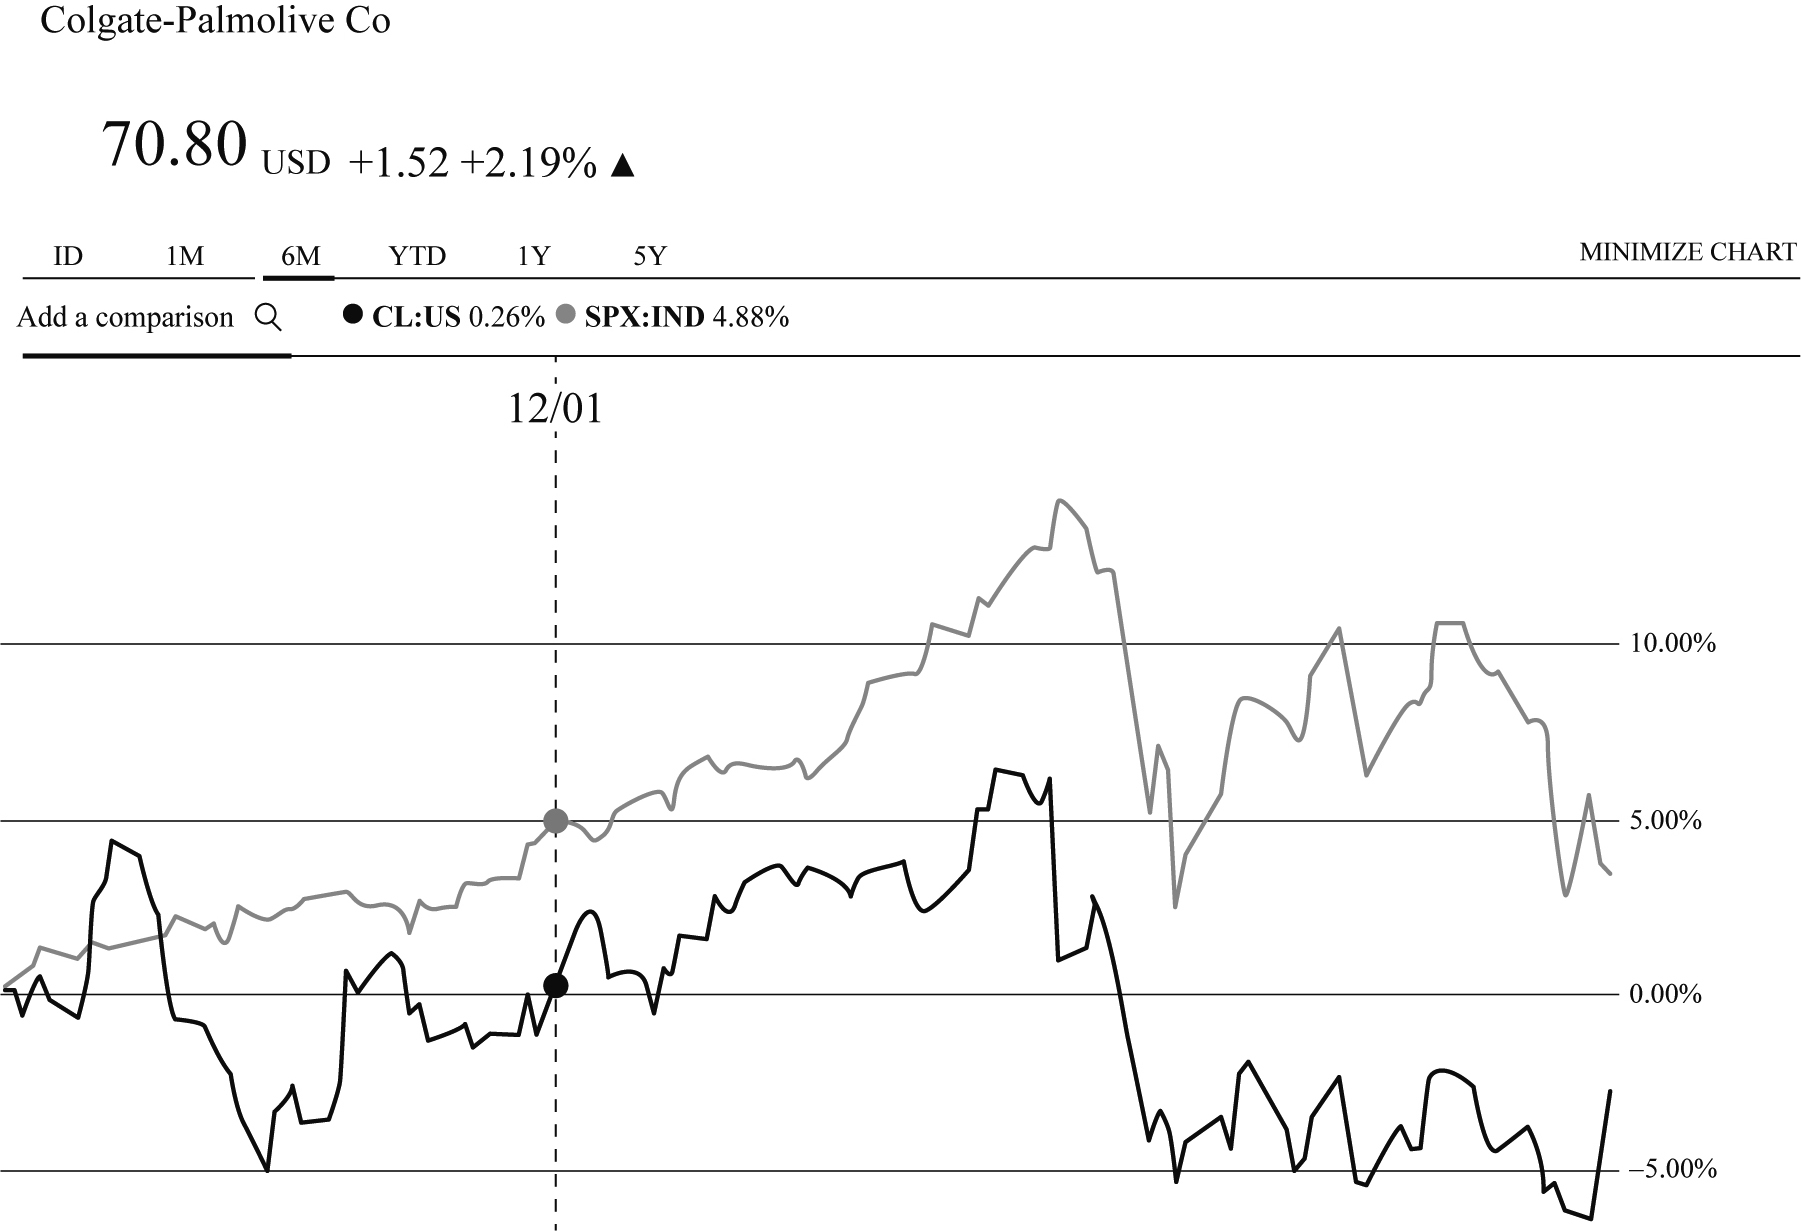
Select one of the four stocks listed in Question 3 by entering the company’s ticker symbol on the financial website you have chosen. On the screen you should see the interactive chart. Select the six-month time period and select the S&P 500, so the stock’s performance will be compared to the S&P 500’s performance on the graph. Has the stock outperformed or underperformed the overall market during this time period?
Expert Solution & Answer
Want to see the full answer?
Check out a sample textbook solution
Students have asked these similar questions
Please explain the price movements of each stock's DIS AND WFC from the past three months. Do the calculations on the spreadsheet show that the company's stock went up or down? Why? Demonstrate a clear understanding of the concept beta of each stock.
Please explain the price movements of each stock's DIS AND WFC from the past three months shown in the spreadsheet.
Demonstrate a clear understanding of the concept beta of each stock.
How do i use the following data to construct a stock bar chart for the 5 day period?
Chapter 8 Solutions
Fundamentals of Financial Management, Concise Edition (with Thomson ONE - Business School Edition, 1 term (6 months) Printed Access Card) (MindTap Course List)
Ch. 8 - Suppose you owned a portfolio consisting of...Ch. 8 - Prob. 2QCh. 8 - Prob. 3QCh. 8 - Is it possible to construct a portfolio of...Ch. 8 - Stock A has an expected return of 7%, a standard...Ch. 8 - A stock had a 12% return last year, a year when...Ch. 8 - If investors aversion to risk increased, would the...Ch. 8 - Prob. 8QCh. 8 - In Chapter 7, we saw that if the market interest...Ch. 8 - Prob. 1P
Ch. 8 - PORTFOLIO BETA An individual has 35,000 invested...Ch. 8 - REQUIRED RATE OF RETURN Assume that the risk-free...Ch. 8 - EXPECTED AND REQUIRED RATES OF RETURN Assume that...Ch. 8 - Prob. 5PCh. 8 - EXPECTED RETURNS Stocks X and Y have the following...Ch. 8 - PORTFOLIO REQUIRED RETURN Suppose you are the...Ch. 8 - BETA COEFFICIENT Given the following information...Ch. 8 - REQUIRED RATE OF RETURN Stock R has a beta of 1.5,...Ch. 8 - Prob. 10PCh. 8 - CAPM AND REQUIRED RETURN Calculate the required...Ch. 8 - REQUIRED RATE OF RETURN Suppose rRF = 9%, rM = 14%...Ch. 8 - CAPM, PORTFOLIO RISK. AND RETURN Consider the...Ch. 8 - Prob. 14PCh. 8 - CAPM AND REQUIRED RETURN HR Industries (HRI) has a...Ch. 8 - CAPM AND PORTFOLIO RETURN You have been managing a...Ch. 8 - PORTFOLIO BETA A mutual fund manager has a 20...Ch. 8 - EXPECTED RETURNS Suppose you won the lottery and...Ch. 8 - EVALUATING RISK AND RETURN Stock X has a 10%...Ch. 8 - Prob. 20PCh. 8 - SECURITY MARKET LINE You plan to invest in the...Ch. 8 - Prob. 22SPCh. 8 - Prob. 23ICCh. 8 - Prob. 1DQCh. 8 - Prob. 2DQCh. 8 - Prob. 3DQCh. 8 - Select one of the four stocks listed in Question 3...Ch. 8 - Go back to the summary page to see an estimate of...Ch. 8 - Prob. 6DQCh. 8 - Prob. 7DQCh. 8 - Beta pf CPB company Beta of the MSI Company is...
Knowledge Booster


Learn more about
Need a deep-dive on the concept behind this application? Look no further. Learn more about this topic, finance and related others by exploring similar questions and additional content below.Similar questions
- Morningstar publishes ratings data on 1,208 company stocks. A sample of 40 of these stocks is contained in the file named Morningstar. Use the Morningstar data set to answer the following questions. a. Develop a point estimate of the proportion of the stocks that receive Morningstars highest rating of 5 Stars. b. Develop a point estimate of the proportion of the Morningstar stocks that are rated Above Average with respect to business risk. c. Develop a point estimate of the proportion of the Morningstar stocks that are rated 2 Stars or less.arrow_forwardThe Dow Jones Industrial Average (DJIA) and the Standard Poors 500 (SP 500) indexes are used as measures of overall movement in the stock market The DJIA is based on the price movements of 30 large companies: the SP 500 is an index composed of 500 stocks. Some say the SP 500 is a better measure of stock market performance because it is broader based. The closing price for the DJIA and the SP 500 for 15 weeks, beginning with January 6, 2012, follow (Barrons web site, April 17, 2012). a. Develop a scatter chart for these data with DJIA as the independent variable. What does the scatter chart indicate about the relationship between DJIA and SP 500? b. Develop an estimated regression equation showing how SP 500 is related to DJIA. What is the estimated regression model? c. What is the 95% confidence interval for the regression parameter 1? Based on this interval, what conclusion can you make about the hypotheses that the regression parameter 1 is equal to zero? d. What is the 95% confidence interval for the regression parameter 0? Based on this interval, what conclusion can you make about the hypotheses that the regression parameter 0 is equal to zero? e. How much of the variation in the sample values of SP 500 does the model estimated in part (b) explain? f. Suppose that the closing price for the DJIA is 13,500. Estimate the closing price for the SP 500. g. Should we be concerned that the DJIA value of 13,500 used to predict the SP 500 value in part (f) is beyond the range of the DJIA used to develop the estimated regression equation?arrow_forwardThe attached file contains hypothetical data for working this problem. Goodman Corporation’s and Landry Incorporated’s stock prices and dividends, along with the Market Index, are shown in the file. Stock prices are reported for December 31 of each year, and dividends reflect those paid during the year. The market data are adjusted to include dividends. Use the data given to calculate annual returns for Goodman, Landry, and the Market Index, and then calculate average returns over the five-year period. (Hint: Remember, returns are calculated by subtracting the beginning price from the ending price to get the capital gain or loss, adding the dividend to the capital gain or loss, and dividing the result by the beginning price. Assume that dividends are already included in the index. Also, you cannot calculate the rate of return for 2015 because you do not have 2014 data.)arrow_forward
- Go to Yahoo.com’s financial website and enter Apple, Inc.’s stock symbol, AAPL. Answer the following questions concerning Apple, Inc. At what price did Apple’s stock last trade? What is the 52-week range of Apple’s stock? When was the last time Apple’s stock hit a 52-week high? What is the annual dividend of Apple’s stock? How many current broker recommendations are strong buy, buy, hold, sell, or strong sell? What is the average of the broker recommendations? What is the price-earnings ratio?arrow_forwardUsing Finance.Yahoo.com, draw a graph of your firm’s stock price movement in the past three years. Has the stock appreciated or depreciated? What is the stock’s highest and lowest price (adjusted for any stock splits) during the past three years? Does your stock pay dividends? If so, how has it changed during that period? I would like to use UnitedHealth Care Group as the company.arrow_forwardThe attached file contains hypothetical data for working this problem. Goodman Corporation’s and Landry Incorporated’s stock prices and dividends, along with the Market Index, are shown in the file. Stock prices are reported for December 31 of each year, and dividends reflect those paid during the year. The market data are adjusted to include dividends. If you formed a portfolio that consisted of 60% Goodman stock and 40% Landry stock, what would be its beta and its required return?arrow_forward
- Based on five years of monthly data, you derive the following information forthe companies listed: Company SDi rm Padma 11.10% 0.82 Meghna 12.60% 0.63 Jamuna 6.60% 0.45 Karnafully 9.70% 0.70 SD on Market 7.60% 1.00 Compute the beta coefficient for each stock.arrow_forwardUsing the data from the following table,calculate the return for investing in this stock from January 1 to December 31. Prices are after the dividend has been paid. Stock Price Dividend Jan 1 $50.18 Mar 31 $51.11 $0.58 Jun 30 $49.56 $0.58 Sep 30 $51.93 $0.75 Dec 31 $52.53 $0.75 The return from January 1 to March 31 is enter your response here. (Round to five decimal places.) Part 2 The return from March 31 to June 30 is enter your response here. (Round to five decimal places.) Part 3 The return from June 30 to September 30 is enter your response here. (Round to five decimal places.) Part 4 The return from September 30 to December 31 is enter your response here. (Round to five decimal places.) Part 5 enter your response here%. (Round to two decimal places.)arrow_forwardThe following are the end-of-month prices for both the Standard & Poor's 500 Index and Nike's common stock. a. Using the data in the popup window, calculate the holding-period returns for each of the months. b. Calculate the average monthly return and the standard deviation for both the S&P 500 and Nike. c. Develop a graph that shows the relationship between the Nike stock returns and the S&P 500 Index. (Show the Nike returns on the vertical axis and the S&P 500 Index returns on the horizontal axis.) d. From your graph, describe the nature of the relationship between Nike stock returns and the returns for the S&P 500 Index.arrow_forward
- The attached file contains hypothetical data for working this problem. Goodman Corporation’s and Landry Incorporated’s stock prices and dividends, along with the Market Index, are shown in the file. Stock prices are reported for December 31 of each year, and dividends reflect those paid during the year. The market data are adjusted to include dividends. Calculate the standard deviation of the returns for Goodman, Landry, and the Market Index. (Hint: Use the sample standard deviation formula given in the chapter, which corresponds to the STDEV function in Excel.)arrow_forwardPercentages need to be entered in decimal format, for instance 3% would be entered as .03.) Stock A and Stock B produced the returns shown on the spreadsheet during the past five years (Year -1 is one year ago, Year -2 is two years ago, and so forth). According to the spreadsheet, what is the average rate of return for each stock during the past five years? (Refer to Row 26 for average rate of return.) Based on the information in the spreadsheet, what is the coefficient of variation for each stock and for the portfolio? (Refer to Row 28 for the coefficient of variation.) If you are a risk-averse investor, would you prefer to hold Stock A, Stock B, or the portfolio? Why? Consider a third stock, Stock C, that is available for inclusion in the portfolio. Stock C produced the returns shown in the table during the past five years (add this to column D under Stock C). What is the average return, standard deviation, and coefficient of variation for Stock C? (Refer to Row 27 for…arrow_forwardYou are given the following information regarding prices for a sample of stocks. PRICE PER SHARE Stock Number of Shares Jan December Honda 20 000 170 200 Nissan 40 000 130 155 Toyota 90 000 138 145 i.) Construct a price-weighted index for these three stocks for January and December ii.) Construct a value weighted index for the securities above for January and December iii) Construct an equal-weighted index by assuming $1,000 is invested in each stock. What is the percentage change in wealth for this portfolio?arrow_forward
arrow_back_ios
arrow_forward_ios
Recommended textbooks for you
 Fundamentals of Financial Management, Concise Edi...FinanceISBN:9781285065137Author:Eugene F. Brigham, Joel F. HoustonPublisher:Cengage Learning
 Fundamentals of Financial Management, Concise Edi...FinanceISBN:9781305635937Author:Eugene F. Brigham, Joel F. HoustonPublisher:Cengage Learning
 Fundamentals Of Financial Management, Concise Edi...FinanceISBN:9781337902571Author:Eugene F. Brigham, Joel F. HoustonPublisher:Cengage Learning
 EBK CONTEMPORARY FINANCIAL MANAGEMENTFinanceISBN:9781337514835Author:MOYERPublisher:CENGAGE LEARNING - CONSIGNMENT
 Managerial AccountingAccountingISBN:9781337912020Author:Carl Warren, Ph.d. Cma William B. TaylerPublisher:South-Western College Pub
 Essentials of Business Analytics (MindTap Course ...StatisticsISBN:9781305627734Author:Jeffrey D. Camm, James J. Cochran, Michael J. Fry, Jeffrey W. Ohlmann, David R. AndersonPublisher:Cengage Learning
Fundamentals of Financial Management, Concise Edi...
Finance
ISBN:9781285065137
Author:Eugene F. Brigham, Joel F. Houston
Publisher:Cengage Learning
Fundamentals of Financial Management, Concise Edi...
Finance
ISBN:9781305635937
Author:Eugene F. Brigham, Joel F. Houston
Publisher:Cengage Learning
Fundamentals Of Financial Management, Concise Edi...
Finance
ISBN:9781337902571
Author:Eugene F. Brigham, Joel F. Houston
Publisher:Cengage Learning
EBK CONTEMPORARY FINANCIAL MANAGEMENT
Finance
ISBN:9781337514835
Author:MOYER
Publisher:CENGAGE LEARNING - CONSIGNMENT
Managerial Accounting
Accounting
ISBN:9781337912020
Author:Carl Warren, Ph.d. Cma William B. Tayler
Publisher:South-Western College Pub
Essentials of Business Analytics (MindTap Course ...
Statistics
ISBN:9781305627734
Author:Jeffrey D. Camm, James J. Cochran, Michael J. Fry, Jeffrey W. Ohlmann, David R. Anderson
Publisher:Cengage Learning
Investing For Beginners (Stock Market); Author: Daniel Pronk;https://www.youtube.com/watch?v=6Jkdpgc407M;License: Standard Youtube License