
Elementary Statistics: Picturing the World (7th Edition)
7th Edition
ISBN: 9780134683416
Author: Ron Larson, Betsy Farber
Publisher: PEARSON
expand_more
expand_more
format_list_bulleted
Videos
Textbook Question
Chapter 8.3, Problem 1TY
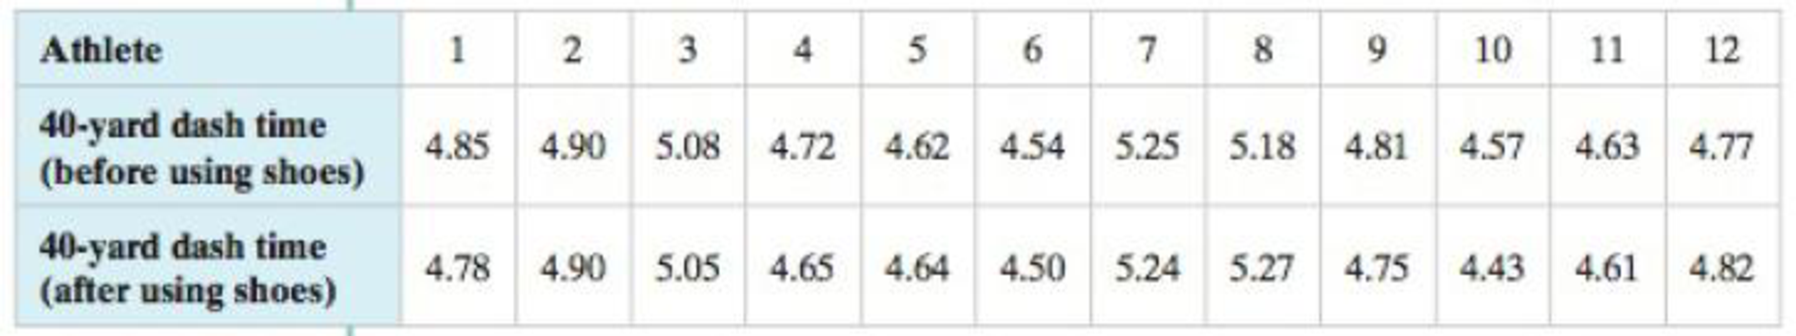
A shoe manufacturer claims that athletes can decrease their times in the 40-yard dash using the manufacturer’s training shoes. The 40-yard dash times of 12 randomly selected athletes are measured. After the athletes have used the shoes for 8 months, their 40-yard dash times are measured again. The times (in seconds) are listed in the table below. At α = 0.05, is there enough evidence to support the manufacturer’s claim? Assume the times are
Expert Solution & Answer
Want to see the full answer?
Check out a sample textbook solution
Students have asked these similar questions
A random group of apartments was selected from a city to analyze the number of bedrooms they have. there evidence to reject the hypothesis that the apartments are equally distributed between 1-bedroom, 2 bedroom and 3-bedroom apartments , at alpha = 0.05
A pharmcuticle company claims that its new drug reduces systolic blood pressure. The systolic blood pressure (in millimeters of Mercury) for 9 patients before taking the new drug and 2 hours after taking the drug are shown in the table below. is there enough evidence support the company's claim?
Let D =(blood pressure before taking new drug)- (blood pressure after taking new drug).use significant levels of a=their 0.05 for the test. Assume that the systolic blood pressure levels are normally distributed for the population of patience both Before & After taking the new drug.
1.State the null and alternative hypothesis for the test.
2. Find the value of the standard deviation of the paired differences. Round to one decimal place.
3.compute the value of the test statistic. Round to three decimal places
4.determine the decision rule for rejecting the null hypothesis Ho. Round the numerical portion to three decimals.
5.make decision for the hypothesis test.
A real estate agent believes that the value of houses in the neighborhood she works in has increased from last year. To test this claim, she selects random houses in this neighborhood and compares their estimated market value in the current year to their estimated market value in the previous year. Suppose that data were collected for a random sample of 8 houses, where each difference is calculated by subtracting the market value of the previous year from the market value of the current year. Assume that the values are normally distributed. The agent uses the alternative hypothesis Ha:μd>0. Using a test statistic of t≈7.496, which has 7 degrees of freedom, determine the range that contains the p-value.
Probability
0.10
0.05
0.025
0.01
0.005
Degrees of Freedom
5
1.476
2.015
2.571
3.365
4.032
6
1.440
1.943
2.447
3.143
3.707
7
1.415
1.895
2.365
2.998
3.499
8
1.397
1.860
2.306
2.896
3.355
9
1.383
1.833
2.262
2.821
3.250
10
1.372
1.812
2.228
2.764
3.169
11…
Chapter 8 Solutions
Elementary Statistics: Picturing the World (7th Edition)
Ch. 8.1 - Classify each pair of samples as independent or...Ch. 8.1 - A survey indicates that the mean annual wages for...Ch. 8.1 - A travel agency claims that the average daily cost...Ch. 8.1 - What is the difference between two samples that...Ch. 8.1 - Explain how to perform a two-sample z-test for the...Ch. 8.1 - Describe another way you can perform a hypothesis...Ch. 8.1 - What conditions are necessary in order to use the...Ch. 8.1 - Prob. 5ECh. 8.1 - Prob. 6ECh. 8.1 - Independent and Dependent Samples In Exercises 58,...
Ch. 8.1 - Prob. 8ECh. 8.1 - In Exercises 9 and 10, use the TI-H4 Plus display...Ch. 8.1 - Prob. 10ECh. 8.1 - Prob. 11ECh. 8.1 - In Exercises 1114, test the claim about the...Ch. 8.1 - In Exercises 1114, test the claim about the...Ch. 8.1 - Prob. 14ECh. 8.1 - Testing the Difference Between Two Means In...Ch. 8.1 - Testing the Difference Between Two Means In...Ch. 8.1 - Prob. 17ECh. 8.1 - Prob. 18ECh. 8.1 - Prob. 19ECh. 8.1 - Testing the Difference Between Two Means In...Ch. 8.1 - Testing the Difference Between Two Means In...Ch. 8.1 - Prob. 22ECh. 8.1 - Prob. 23ECh. 8.1 - Prob. 24ECh. 8.1 - Prob. 25ECh. 8.1 - Getting at the Concept Explain why the null...Ch. 8.1 - Testing a Difference Other Than Zero Sometimes a...Ch. 8.1 - Testing a Difference Other Than Zero Sometimes a...Ch. 8.1 - Prob. 29ECh. 8.1 - Architect Salaries Construct a 99% confidence...Ch. 8.2 - The annual earnings of 25 people with a high...Ch. 8.2 - A manufacturer claims that the mean driving cost...Ch. 8.2 - What conditions are necessary in order to use the...Ch. 8.2 - Explain how to perform a two-sample t-test for the...Ch. 8.2 - Prob. 3ECh. 8.2 - Prob. 4ECh. 8.2 - Prob. 5ECh. 8.2 - Prob. 6ECh. 8.2 - In Exercises 38, use Table 5 in Appendix B to find...Ch. 8.2 - Prob. 8ECh. 8.2 - In Exercises 912, test the claim about the...Ch. 8.2 - Prob. 10ECh. 8.2 - Prob. 11ECh. 8.2 - In Exercises 912, test the claim about the...Ch. 8.2 - Testing the Difference Between Two Means in...Ch. 8.2 - Testing the Difference Between Two Means in...Ch. 8.2 - Testing the Difference Between Two Means in...Ch. 8.2 - Testing the Difference Between Two Means in...Ch. 8.2 - Prob. 17ECh. 8.2 - Prob. 18ECh. 8.2 - Prob. 19ECh. 8.2 - Testing the Difference Between Two Means in...Ch. 8.2 - Testing the Difference Between Two Means in...Ch. 8.2 - Testing the Difference Between Two Means in...Ch. 8.2 - Constructing Confidence Intervals for 1 2 When...Ch. 8.2 - Constructing Confidence Intervals for 1 2 When...Ch. 8.2 - Constructing Confidence Intervals for 1 2 When...Ch. 8.2 - Prob. 26ECh. 8.2 - How Protein Affects Weight Gain in Overeaters In a...Ch. 8.2 - Prob. 2CSCh. 8.2 - How Protein Affects Weight Gain in Overeaters In a...Ch. 8.2 - Prob. 4CSCh. 8.2 - Prob. 5CSCh. 8.3 - A shoe manufacturer claims that athletes can...Ch. 8.3 - Prob. 2TYCh. 8.3 - Prob. 1ECh. 8.3 - Prob. 2ECh. 8.3 - Prob. 3ECh. 8.3 - Prob. 4ECh. 8.3 - Prob. 5ECh. 8.3 - Prob. 6ECh. 8.3 - Prob. 7ECh. 8.3 - Prob. 8ECh. 8.3 - Prob. 9ECh. 8.3 - Testing the Difference Between Two Means In...Ch. 8.3 - Prob. 11ECh. 8.3 - Prob. 12ECh. 8.3 - Prob. 13ECh. 8.3 - Testing the Difference Between Two Means In...Ch. 8.3 - Prob. 15ECh. 8.3 - Prob. 16ECh. 8.3 - Testing the Difference Between Two Means In...Ch. 8.3 - Testing the Difference Between Two Means In...Ch. 8.3 - Testing the Difference Between Two Means In...Ch. 8.3 - Prob. 20ECh. 8.3 - Prob. 21ECh. 8.3 - Prob. 22ECh. 8.3 - Prob. 23ECh. 8.3 - Prob. 24ECh. 8.4 - Consider the results of the study discussed on...Ch. 8.4 - Prob. 2TYCh. 8.4 - What conditions are necessary in order to use the...Ch. 8.4 - Explain how to perform a two-sample z-test for the...Ch. 8.4 - In Exercises 36, determine whether a normal...Ch. 8.4 - Prob. 4ECh. 8.4 - Prob. 5ECh. 8.4 - In Exercises 36, determine whether a normal...Ch. 8.4 - Prob. 7ECh. 8.4 - Testing the Difference Between Two Proportions In...Ch. 8.4 - Prob. 9ECh. 8.4 - Prob. 10ECh. 8.4 - Prob. 11ECh. 8.4 - Testing the Difference Between Two Proportions In...Ch. 8.4 - Prob. 13ECh. 8.4 - Prob. 14ECh. 8.4 - Intermarriages In Exercises 1318, use the figure,...Ch. 8.4 - Prob. 16ECh. 8.4 - Prob. 17ECh. 8.4 - Intermarriages In Exercises 1318, use the figure,...Ch. 8.4 - Prob. 19ECh. 8.4 - Prob. 20ECh. 8.4 - Prob. 21ECh. 8.4 - U.S. Workforce In Exercises 1922, use the figure...Ch. 8.4 - Prob. 23ECh. 8.4 - Prob. 24ECh. 8.4 - Prob. 25ECh. 8.4 - Prob. 26ECh. 8 - Uses Hypothesis Testing with Two Samples...Ch. 8 - Medical research often involves blind and...Ch. 8 - Prob. 8.1.1RECh. 8 - Prob. 8.1.2RECh. 8 - Sample 1: The fuel efficiencies of 20 sports...Ch. 8 - Prob. 8.1.4RECh. 8 - Prob. 8.1.5RECh. 8 - In Exercises 58, test the claim about the...Ch. 8 - Prob. 8.1.7RECh. 8 - In Exercises 58, test the claim about the...Ch. 8 - In Exercises 9 and 10, (a) identify the claim and...Ch. 8 - Prob. 8.1.10RECh. 8 - Prob. 8.2.11RECh. 8 - Prob. 8.2.12RECh. 8 - Prob. 8.2.13RECh. 8 - Prob. 8.2.14RECh. 8 - Prob. 8.2.15RECh. 8 - Prob. 8.2.16RECh. 8 - Prob. 8.2.17RECh. 8 - Prob. 8.2.18RECh. 8 - Prob. 8.3.19RECh. 8 - In Exercises 1922, test the claim about the mean...Ch. 8 - Prob. 8.3.21RECh. 8 - Prob. 8.3.22RECh. 8 - Prob. 8.3.23RECh. 8 - In Exercises 23 and 24, (a) identify the claim and...Ch. 8 - Prob. 8.4.25RECh. 8 - Prob. 8.4.26RECh. 8 - Prob. 8.4.27RECh. 8 - Prob. 8.4.28RECh. 8 - Prob. 8.4.29RECh. 8 - Prob. 8.4.30RECh. 8 - Prob. 1CQCh. 8 - Prob. 2CQCh. 8 - Prob. 3CQCh. 8 - Prob. 4CQCh. 8 - Take this test as you would take a test in class....Ch. 8 - Prob. 2CTCh. 8 - A physical therapist suggests that soft tissue...Ch. 8 - Take this test as you would take a test in class....Ch. 8 - The U.S. Department of Health Human Services...Ch. 8 - Prob. 2RSRDCh. 8 - Prob. 3RSRDCh. 8 - Prob. 4RSRDCh. 8 - Prob. 1TCh. 8 - Prob. 2TCh. 8 - Prob. 3TCh. 8 - Prob. 4TCh. 8 - Prob. 5TCh. 8 - Prob. 1CRCh. 8 - Prob. 2CRCh. 8 - Prob. 3CRCh. 8 - Prob. 4CRCh. 8 - In Exercises 36, construct the indicated...Ch. 8 - In Exercises 36, construct the indicated...Ch. 8 - In Exercises 710, the statement represents a...Ch. 8 - In Exercises 710, the statement represents a...Ch. 8 - In Exercises 710, the statement represents a...Ch. 8 - In Exercises 710, the statement represents a...Ch. 8 - Prob. 11CRCh. 8 - Prob. 12CRCh. 8 - Prob. 13CRCh. 8 - Prob. 14CRCh. 8 - Prob. 15CRCh. 8 - Prob. 16CRCh. 8 - A researcher claims that 5% of people who wear...
Knowledge Booster


Learn more about
Need a deep-dive on the concept behind this application? Look no further. Learn more about this topic, statistics and related others by exploring similar questions and additional content below.Similar questions
- A survey of 90 recently delivered women on the rolls of a county welfare department revealed that 27 had a history of intrapartum or postpartum infection. Can we conclude that the population proportion with a history of intrapartum or postpartum infection is significantly less than or equal to 0.25? Let alpha = 0.05.arrow_forwardDoes the data need to be normally distributed for a t-test to work?arrow_forwardThe germination rate of seeds is defined as the proportion of seeds that, when properly planted and watered, sprout and grow. A certain variety of grass seed usually has a germination rate of 0.80, and a company wants to see if spraying the seeds with a chemical that is known to change germination rates in other species will change the germination rate of this grass species. (a) Suppose the company plans to spray a random sample of 400 seeds and conduct a two-sided test of 0: 0.8Hpusing = 0.05. They determine that the power of this test against the alternative 0.75pis 0.69. Interpret the power of this test.(b) Describe two ways the company can increase the power of the test. What is a disadvantage of each of these ways? (c) The company researchers spray 400 seeds with the chemical and 307 of the seeds germinate. This produces a 95% confidence interval for the proportion of seeds that germinate of (0.726, 0.809). Use this confidence interval to determine whether the test described in…arrow_forward
- An analogue signal received at a detector, measured in microvolts, is normally distributed with mean of 185 and variance of 244. What is the probability that is the signal will be less than 203 µV given that it is less than 184 µV?arrow_forwardA random sample of 22 women participated in a study testing whether a new banana boat sunscreen reduced their incident rate of sunburn during the summer. The average woman in the study reported getting burned 5.7 times over the past 3 months, with a SS = 179. Compare this incident rate to a rate of 7 times per 3 months. Use an alpha of .05, 2 tailed test. a) What is the t-critical value(s)? b) What is the estimated standard error? c) Compute the t-statistic. d) Make a decision regarding the null and provide a conclusion (explain what it means in regards to this particular study).arrow_forwardA snack food manufacturer estimates that the variance of the number of grams of carbohydrates in servings of its tortilla chips is 1.23. A dietician is asked to test this claim and finds that a random sample of 24 servings has a variance of 1.27. At α=0.10, is there enough evidence to reject the manufacturer's claim? Assume the population is normally distributed. (b) Find the critical value(s). I do not know how to calculate the critical value with my calculator. I have a TI83+.arrow_forward
- The desired percentage of SiO2 in a certain type of aluminous cement is 5.5. To test whether the true average percentage is 5.5 for a particular production facility, 16 independently obtained samples are analyzed. Suppose that the percentage of SiO2 in a sample is normally distributed with σ = .3. Assume that the sample mean is 5.25. (a) Does this indicate that the true average percentage differs from 5.5? Carry out a test at α = .01. (b) If the true average percentage is µ = 5.6, what is the probability of type II error?arrow_forwardUse the standard error to construct the approximate prediction interval for Y using an alpha of 5%.arrow_forwardLet X1, ..., Xn be a sample from an exponential population with parameter λ.(a) Find the maximum likelihood estimator for λ. (b) Is the estimator unbiased?(c) Is the estimator consistent?arrow_forward
arrow_back_ios
arrow_forward_ios
Recommended textbooks for you
 Glencoe Algebra 1, Student Edition, 9780079039897...AlgebraISBN:9780079039897Author:CarterPublisher:McGraw Hill
Glencoe Algebra 1, Student Edition, 9780079039897...
Algebra
ISBN:9780079039897
Author:Carter
Publisher:McGraw Hill
Hypothesis Testing using Confidence Interval Approach; Author: BUM2413 Applied Statistics UMP;https://www.youtube.com/watch?v=Hq1l3e9pLyY;License: Standard YouTube License, CC-BY
Hypothesis Testing - Difference of Two Means - Student's -Distribution & Normal Distribution; Author: The Organic Chemistry Tutor;https://www.youtube.com/watch?v=UcZwyzwWU7o;License: Standard Youtube License