
Videos
A sample of n sludge specimens is selected and the pH of each one is determined. The one-sample t test will then be used to see if there is compelling evidence for concluding that true average pH is less than 7.0. What conclusion is appropriate in each of the following situations?
- a. n = 6, t = −2.3, α = .05
- b. n = 15, t = −3.1, α = .01
- c. n = 12, t = −1.3, α = .05
- d. n = 6, t = .7, α = .05
- e. n = 6,
a.
Find the appropriate conclusion for the given situation.
Answer to Problem 30E
There is sufficient evidence to support that true average pH is less than 7 for this situation.
Explanation of Solution
Given info:
A sample of size n sludge specimens was collected for checking pH. The t test was used for concluding that true average pH is less than 7.
Calculation:
Hypothesis:
Null hypothesis:
Alternative hypothesis:
P-value:
Software procedure:
Step by step procedure to obtain the P-value using the MINITAB software is given below:
- Choose Graph > Probability Distribution Plot choose View Probability > OK.
- From Distribution, choose ‘t’ distribution, degrees of freedom as 5.
- Click the Shaded Area tab.
- Choose X Value and left for the region of the curve to shade.
- Enter the data value as –2.3.
- Click OK.
Output using the MINITAB software is given below:
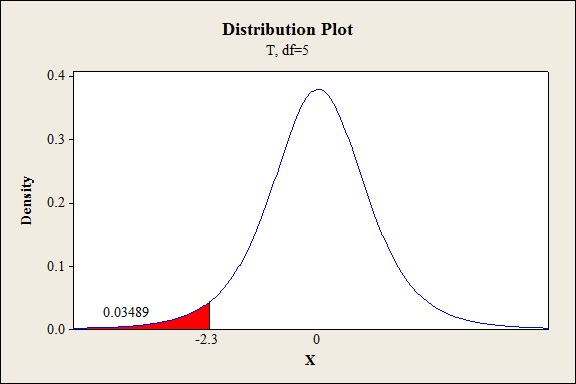
From the MINITAB output, the P-value is 0.0348.
Decision:
If
If
Conclusion:
Here, the P-value is less than the level of significance.
That is,
By rejection rule, reject null hypothesis.
Hence, there is sufficient evidence to support that true average pH is less than 7 for this situation.
b.
Find the appropriate conclusion for the given situation.
Answer to Problem 30E
There is sufficient evidence to support that true average pH is less than 7 for this situation.
Explanation of Solution
Given info:
Calculation:
P-value:
Software procedure:
Step by step procedure to obtain the P-value using the MINITAB software is given below:
- Choose Graph > Probability Distribution Plot choose View Probability > OK.
- From Distribution, choose ‘t’ distribution, degrees of freedom as 14.
- Click the Shaded Area tab.
- Choose X Value and left for the region of the curve to shade.
- Enter the data value as –3.1.
- Click OK.
Output using the MINITAB software is given below:
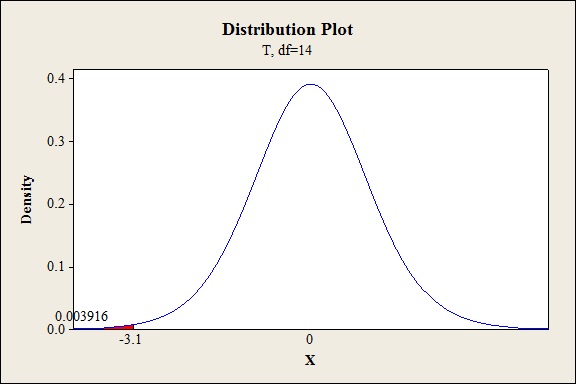
From the MINITAB output, the P-value is 0.0039.
Conclusion:
Here, the P-value is less than the level of significance.
That is,
By rejection rule, reject null hypothesis.
Hence, there is sufficient evidence to support that true average pH is less than 7 for this situation.
c.
Find the appropriate conclusion for the given situation.
Answer to Problem 30E
There is no sufficient evidence to support that true average pH is less than 7 for this situation.
Explanation of Solution
Given info:
Calculation:
P-value:
Software procedure:
Step by step procedure to obtain the P-value using the MINITAB software is given below:
- Choose Graph > Probability Distribution Plot choose View Probability > OK.
- From Distribution, choose ‘t’ distribution, degrees of freedom as 11.
- Click the Shaded Area tab.
- Choose X Value and left for the region of the curve to shade.
- Enter the data value as –1.3.
- Click OK.
Output using the MINITAB software is given below:
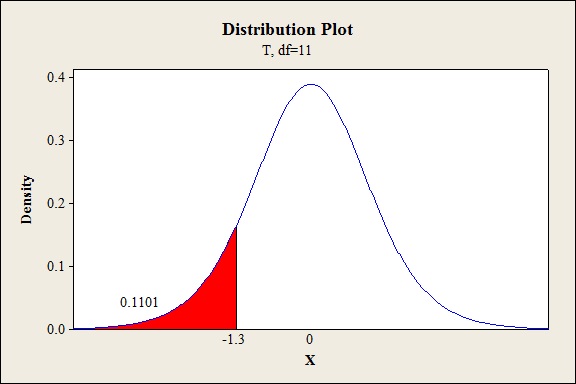
From the MINITAB output, the P-value is 0.1101
Conclusion:
Here, the P-value is greater than the level of significance.
That is,
By rejection rule, fail to reject null hypothesis.
Hence, there is no sufficient evidence to support that true average pH is less than 7 for this situation.
d.
Find the appropriate conclusion for the given situation.
Answer to Problem 30E
There is no sufficient evidence to support that true average pH is less than 7 for this situation.
Explanation of Solution
Given info:
Calculation:
P-value:
Software procedure:
Step by step procedure to obtain the P-value using the MINITAB software is given below:
- Choose Graph > Probability Distribution Plot choose View Probability > OK.
- From Distribution, choose ‘t’ distribution, degrees of freedom as 5.
- Click the Shaded Area tab.
- Choose X Value and left for the region of the curve to shade.
- Enter the data value as 0.7.
- Click OK.
Output using the MINITAB software is given below:
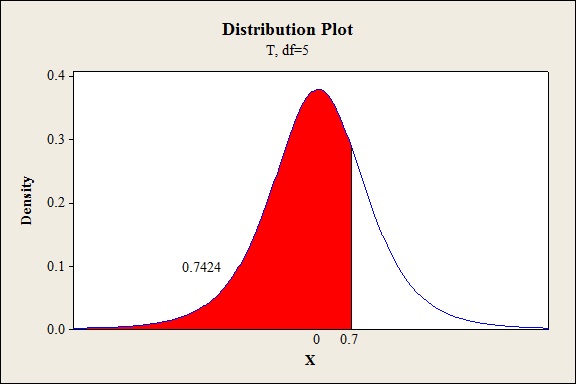
From the MINITAB output, the P-value is 0.7424.
Conclusion:
Here, the P-value is greater than the level of significance.
That is,
By rejection rule, fail to reject null hypothesis.
Hence, there is no sufficient evidence to support that true average pH is less than 7 for this situation.
e.
Find the appropriate conclusion for the given situation.
Answer to Problem 30E
There is sufficient evidence to support that true average pH is less than 7 at 5% level of significance.
Explanation of Solution
Given info:
Calculation:
Step 1: Parameter of interest:
Let
Step 2: Null hypothesis:
Step 3: Alternative hypothesis:
Step 4: Test statistic:
Software procedure:
Step by step procedure to obtain the test-statistic value using the MINITAB software:
- Choose Stat > Basic Statistics > 1-Sample Z.
- In Summarized data, enter the sample size as 6 and mean as 6.68.
- In Standard deviation, enter 0.2.
- In Perform hypothesis test, enter the test mean as 7
- Check Options; enter Confidence level as 95%.
- Choose less than in alternative.
- Click OK in all dialogue boxes.
Output using the MINITAB software is given below:
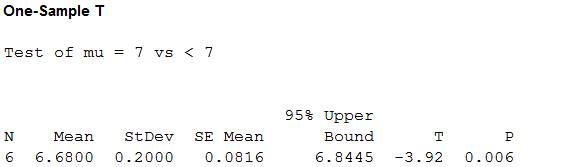
From the MINITAB output, the test statistic value is –3.92
Step 5: P-value:
From the output of step 4, the P-value is given by 0.006.
Step 5: Decision:
If
If,
Conclusion:
Here, the P-value is less than the level of significance.
That is,
By rejection rule, reject null hypothesis.
Step 6: Interpretation:
Thus, it can be concluded that there is sufficient evidence to support that true average pH is less than 7 at 5% level of significance.
Want to see more full solutions like this?
Chapter 8 Solutions
Probability and Statistics for Engineering and the Sciences


- The desired percentage of SiO2 in a certain type of aluminous cement is 5.5. To test whether the true average percentage is 5.5 for a particular production facility, 16 independently obtained samples are analyzed. Suppose that the percentage of SiO2 in a sample is normally distributed with ? = 0.32 and that x = 5.21. (Use ? = 0.05.) (a) Does this indicate conclusively that the true average percentage differs from 5.5?State the appropriate null and alternative hypotheses. H0: ? = 5.5Ha: ? ≠ 5.5H0: ? = 5.5Ha: ? ≥ 5.5 H0: ? = 5.5Ha: ? < 5.5H0: ? = 5.5Ha: ? > 5.5 Calculate the test statistic and determine the P-value. (Round your test statistic to two decimal places and your P-value to four decimal places.) z = P-value = State the conclusion in the problem context. Do not reject the null hypothesis. There is sufficient evidence to conclude that the true average percentage differs from the desired percentage.Reject the null hypothesis. There is sufficient evidence…arrow_forward1. A researcher reports an F-ratio with df(between) = 3 and df(within) = 28. How many treatment conditions were compared in the experiment? If samples have an equal number of participants, how many are in each treatment? 2. A researcher obtains an F = 4.10 with df = 2, 14. Is this value sufficient to reject the null with α = .05? Is it sufficient enough to reject the null with α = .01?arrow_forwardTo test the water boiling point temperature,( 9) measurements were taken out as below:(99.3, 99.4, 99.2, 99.5, 99.6, 99.9, 99.6, 99.4 , 99.8) Co, with a population standard deviation = 1.2 Co.Test the hypothesis that (100 Co) is the boiling point of water or not using α = 5%?arrow_forward
- A test of H0H0:μ=1:μ=1 against HaHa:μ>1:μ>1 has test statistic zz = 1.74. Answer "Yes/Y" or "No/N" to the following questions. Is this test significant at the 2.5% level (αα = 0.025)? Is it significant at the 0.5% level (αα = 0.005)?arrow_forwardArandom sample of 450 observations produced a sample proportion equal to 0.38. Find the critical and observed values of z for the following test of hypotheses using alpha = 0.025 . H 0 :p=0.30 versus H 1 :p not equal to 0.30arrow_forwardAssume that ρxy = .30 between weight and exercise for the population of normal adults. However, a researcher believes the relationship is stronger for children. The researcher tests a sample of 28 children and obtains an rxy = .47. Does this result support the researcher’s belief? Conduct an appropriate statistical test using an alpha level of .05.arrow_forward
- Assuming all other factors are held constant, if the df value for a two-tailed t-test with a = .05 were increased from df =6 to df = 20, what would happen to the critical values for t?arrow_forwardA sample of patients is tested to determine if they have any hospital borne infections. How large of a sample must be collected to be accurate within 0.01 at the 1% level of significance, if the hospital estimates the true proportion of patients infected is 0.045? p̂ = q̂ = E = Z= n=arrow_forwardA survey of 90 recently delivered women on the rolls of a county welfare department revealed that 27 had a history of intrapartum or postpartum infection. What is the critical value of z if we need to conclude that the population proportion with a history of intrapartum or postpartum infection is less than 0.25.arrow_forward
- The tests of assumptions for yield gave values for Levene’s statistic and Shapiro-Wilk’s as 0.0562 and .00271, respectively. At a=0.05 , which statistical test is most appropriate to compare the yield among the nitrogen rates? a. Cochran’s Q B. Friedman’s C. Kruskal Wallis test . D. Anova F-testarrow_forwardAssume we wanted to show that the true proportion of virginica iris seeds that fail to germinate is less than 20%. Let's say we tested at an alpha of 0.05, and found a p-vale of 0.082. Which of the following would be an appropriate conclusion and interpretation? A) With an alpha of 0.05, and a p-value of 0.082, we fail to reject the null and state we have insufficient evidence to support that the true proportion of virginica iris seeds that fail to germinate is less than 20%. B) With an alpha of 0.05, and a p-value of 0.0082, we reject the null and state we have sufficient evidence to support that the true proportion of virginica iris seeds that fail to germinate is less than 20%. C) With an alpha of 0.05, and a p-value of 0.082, we reject the null and state we have sufficient evidence to support that the true proportion of virginica iris seeds that fail to germinate is less than 20%. D) With an alpha of 0.05, and a p-value of 0.082, we fail to reject the null and state…arrow_forward1) The desired percentage of SiO2 in a certain type of aluminous cement is 5.5. To test whether the true average percentage is 5.5 for a particular production facility, 16 independently obtained samples are analyzed. Suppose that the percentage of SiO2 in a sample is normally distributed with σ = 0.32 and that x = 5.21. (Use α = 0.05.) What value of n is required to satisfy α = 0.01 and β(5.6) = 0.01? (Round your answer up to the next whole number.) 2) Consider a paint-drying situation in which drying time for a test specimen is normally distributed with σ = 7. The hypotheses H0: μ = 74 and Ha: μ < 74 are to be tested using a random sample of n = 25 observations. The number of standard deviations (of X) below the null value x = 72.3 is 1.21. If x = 72.3, the conclusion using α = 0.003 : z = -1.21 P-value = 0.1123 If the test procedure with α = 0.003 is used, what n is necessary to ensure that β(70) = 0.01? (Round your answer up to the next whole number.)arrow_forward
 MATLAB: An Introduction with ApplicationsStatisticsISBN:9781119256830Author:Amos GilatPublisher:John Wiley & Sons Inc
 Probability and Statistics for Engineering and th...StatisticsISBN:9781305251809Author:Jay L. DevorePublisher:Cengage Learning
 Statistics for The Behavioral Sciences (MindTap C...StatisticsISBN:9781305504912Author:Frederick J Gravetter, Larry B. WallnauPublisher:Cengage Learning
 Elementary Statistics: Picturing the World (7th E...StatisticsISBN:9780134683416Author:Ron Larson, Betsy FarberPublisher:PEARSON
 The Basic Practice of StatisticsStatisticsISBN:9781319042578Author:David S. Moore, William I. Notz, Michael A. FlignerPublisher:W. H. Freeman
 Introduction to the Practice of StatisticsStatisticsISBN:9781319013387Author:David S. Moore, George P. McCabe, Bruce A. CraigPublisher:W. H. Freeman