
Concept explainers
Videos
a.
Find the sample proportion
a.
Answer to Problem 9E
The value of sample proportion
Explanation of Solution
In a simple random sample of 80 individuals, only 54 individuals are in the group of interest.
The sample proportion
Where, x be the number of observations, n be the sample size.
Substitute the corresponding values to get the proportion,
Thus, the sample proportion
b.
Check whether the assumptions for the hypothesis test are satisfied.
b.
Answer to Problem 9E
Yes, the assumptions for the hypothesis test are satisfied.
Explanation of Solution
Assumptions for performing a hypothesis test for a population proportion:
- The samples taken from the population are simple random samples.
- The population is at least 20 times as large as the sample.
- The samples in the population are divided into two categories.
- The values of
Requirement check:
- The sample of 80 is obtained by simple random sampling.
- The information about the population size is not known. The population size is assumed to be more than 20 times as large as the sample.
- The samples in the population seemed to be categorized into two parts. That is, individuals under the category of interest and individuals not under the category of interest.
- Verify the condition:
Substitute n as 80 and
Substitute n as 80 and
Therefore, all the conditions are satisfied.
c.
Find the value of test statistic.
c.
Answer to Problem 9E
The value of test statistic is –2.8.
Explanation of Solution
Calculation:
Denote p as the true population proportion.
The given test hypotheses are:
Null hypothesis:
That is, the true proportion of the individuals under the category of interest is 0.8.
Alternate hypothesis:
That is, the true proportion of the individuals under the category of interest is less than 0.8.
Test statistic:
The z-test statistic is:
Where,
Software procedure:
Step by step procedure to find the test statistic using the MINITAB software:
- Choose Stat > Basic Statistics > 1-Proportion.
- In Number of trials, enter the Sample size as 80 and in Number of
Events , Enter Number of observations as 54. - Enter Hypothesized proportion as 0.8.
- Select Options.
- Choose
- Click OK in all dialogue boxes.
The output using Minitab is given below:
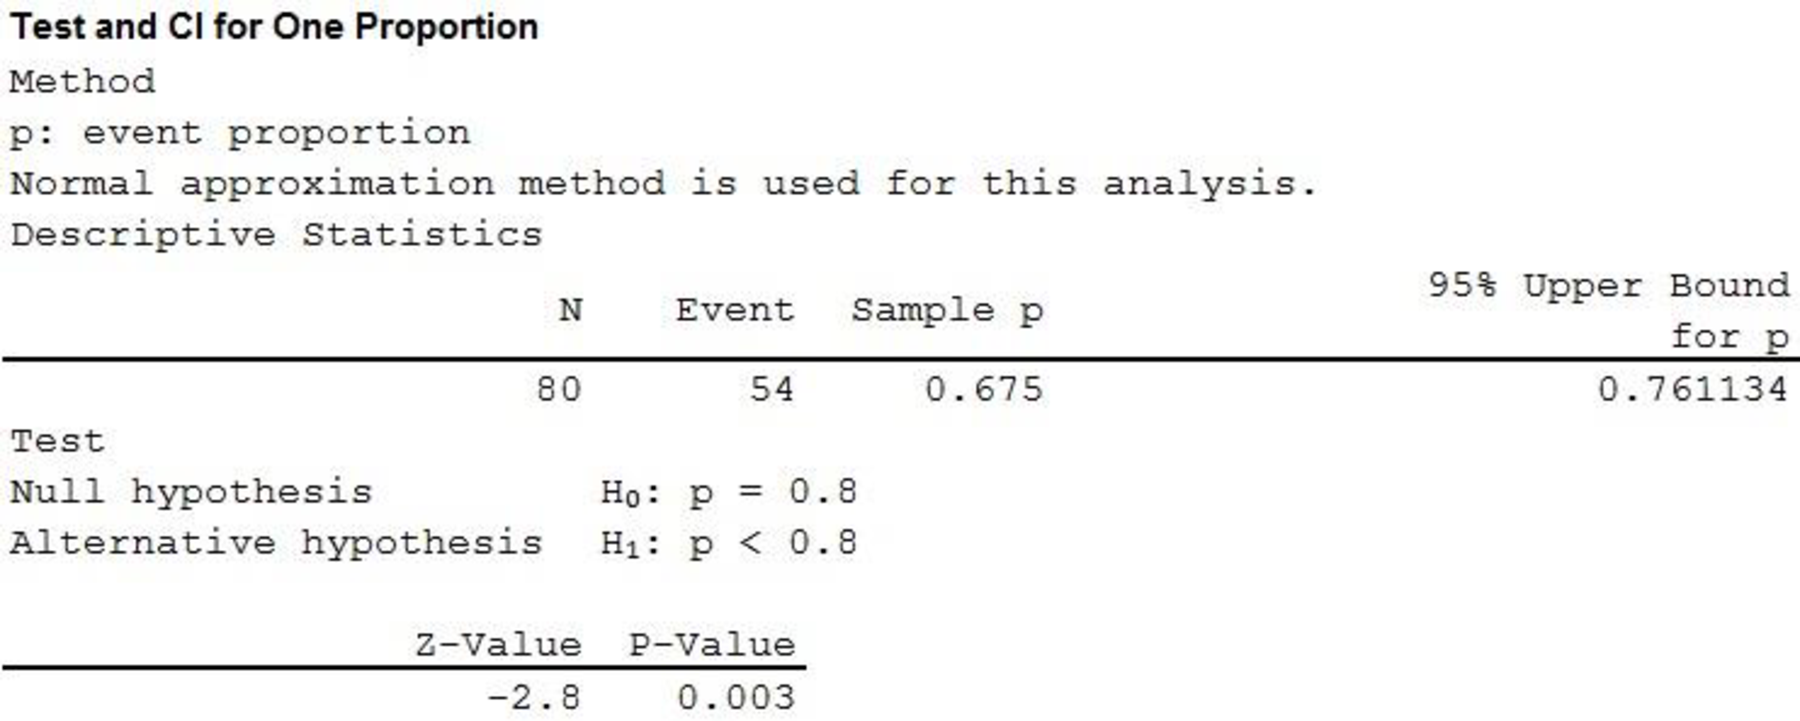
From the MINITAB output, the test statistic, that is, the z-value is –2.8.
Thus, the value of test statistic z is –2.8.
d.
Decide whether the null hypothesis
d.
Answer to Problem 9E
The null hypothesis
Explanation of Solution
From previous part (c), it has been found that the value of test statistic z is –2.80.
From the given hypothesis, the alternative hypothesis contains the less than
From Table 8.1 “Table of Critical Values”, the critical value for left-tailed test at
For left-tailed test, the critical region will be the observed values which lie below the critical value of –1.645.
Therefore, the critical region is
For left-tailed test: If
For right-tailed test: If
For two-tailed test: If
Conclusion:
The critical value at
Here, the test statistic value of –2.80 is less than –1.645, that is, lies in the critical region.
That is,
Therefore, the null hypothesis is rejected.
Hence, there is evidence that the true proportion of the individuals under the category of interest is less than 0.80.
Want to see more full solutions like this?
Chapter 8 Solutions
Essential Statistics


- A doctor wants to compare the average price between two different brands of sanitizer during theCOVID-19 outbreaks. For this reason, he has recorded the selling price of Brand A and B based on sixand five random selected stores, respectively. The recorded prices are recorded in Table 2. Based onthe sample data, at 0.01 level of significance, can we claim that the average price of Brand A is higherthan Brand B? Make your conclusion using the p- value approach, with the aid of Mic. OfficeEXCEL. Table 2Brand A RM10.50 RM11.00 RM11.50 RM11.20 RM12.00 RM11.80Brand B RM11.00 RM12.00 RM10.70 RM12.20 RM10.40 RM10.50 RM12.20arrow_forwardA manufacturer must test that his bolts are 4.00cm long when they come off the assembly line. He must recalibrate his machines if the bolts are too long or too short. After sampling 169 randomly selected bolts off the assembly line, he calculates the sample mean to be 4.07cm. He knows that the population standard deviation is 0.45cm. Assuming a level of significance of 0.02, is there sufficient evidence to show that the manufacturer needs to recalibrate the machines?arrow_forwardAccording to a survey, the average American person is in a car for 5 hours per week. To test if the amount of car time in Los Angeles is less than the national average, a researcher decides to do a hypothesis test, at a 10% significance level. She surveys 15 Los Angeleans randomly and asks them about their amount of time in a car each week, on average. From the data, the sample mean time is 4.3 hours per week, and the sample standard deviation (s) is 0.7 hours. H0: μ≤5; Ha: μ>5. α=0.1 (significance level) What is the test statistic (t-value) of this one-mean hypothesis test (with σ unknown)? Round your final answer to two decimal places.arrow_forward
- Only 16% of registered voters voted in the last election. Will voter participation increase for the upcoming election? Of the 327 randomly selected registered voters surveyed, 56 of them will vote in the upcoming election. What can be concluded at the αα = 0.05 level of significance? For this study, we should use: z-test for a population proportion or t-test for a population mean The null and alternative hypotheses would be: H0:H0: ? μ p Select an answer ≠ < = > (please enter a decimal) H1:H1: ? p μ Select an answer > = ≠ < (Please enter a decimal) The test statistic ? z or t = (please show your answer to 3 decimal places.) The p-value = (Please show your answer to 4 decimal places.) The p-value is ? > ≤ αα Based on this, we should Select an answer: accept, reject or fail to reject the null hypothesis. Thus, the final conclusion is that ... The data suggest the population proportion is not significantly higher than 16% at αα = 0.05, so there…arrow_forwardOnly 11% of registered voters voted in the last election. Will voter participation increase for the upcoming election? Of the 369 randomly selected registered voters surveyed, 59 of them will vote in the upcoming election. What can be concluded at the αα = 0.05 level of significance? For this study, we should use T test population for mean or Z test for a population proportion The null and alternative hypotheses would be: H0:H0: p or u, <,>,= (please enter a decimal) H1:H1: p or u, <,>,= (Please enter a decimal) The test statistic Z or T = (please show your answer to 3 decimal places.) The p-value = (Please show your answer to 4 decimal places.) The p-value is <,> αα Based on this, we should fail to reject, reject, or accept the null hypothesis. Thus, the final conclusion is that ... The data suggest the population proportion is not significantly higher than 11% at αα = 0.05, so there is statistically…arrow_forwardA ferry will safely accommodate 86 tons of passenger cars. Assume that the mean weight of a passenger car is 2.1 tons with standard deviation 0.6 tons. If a random sample of 38 cars are loaded onto the ferry, what is the probability that the maximum safe weight will be exceeded?arrow_forward
- Only 15% of registered voters voted in the last election. Will voter participation increase for the upcoming election? Of the 363 randomly selected registered voters surveyed, 58 of them will vote in the upcoming election. What can be concluded at the αα = 0.01 level of significance? For this study, we should use Select an answer t-test for a population mean z-test for a population proportion The null and alternative hypotheses would be: H0:H0: ? μ p Select an answer > < ≠ = (please enter a decimal) H1:H1: ? μ p Select an answer = < ≠ > (Please enter a decimal) The test statistic ? t z = (please show your answer to 3 decimal places.) The p-value = (Please show your answer to 4 decimal places.) The p-value is ? > ≤ αα Based on this, we should Select an answer accept reject fail to reject the null hypothesis. Thus, the final conclusion is that ... The data suggest the population proportion is not significantly higher than 15% at αα = 0.01, so there…arrow_forwardA random sample of 319 front-seat occupants involved in head-on collisions in a certain region resulted in 95 who sustained no injuries. We wish to use this sample data to test whether the true proportion of uninjured occupants in head-on collisions exceeds 0.25 or not. What would your conclusions be for this test of hypothesis, given a 5% significance level?arrow_forwardOnly 18% of registered voters voted in the last election. Will voter participation decline for the upcoming election? Of the 329 randomly selected registered voters surveyed, 43 of them will vote in the upcoming election. What can be concluded at the αα = 0.10 level of significance? For this study, we should use Select an answer t-test for a population mean z-test for a population proportion The null and alternative hypotheses would be: H0:H0: ? p μ Select an answer > < ≠ = (please enter a decimal) H1:H1: ? p μ Select an answer = < ≠ > (Please enter a decimal) The test statistic ? t z = (please show your answer to 3 decimal places.) The p-value = (Please show your answer to 4 decimal places.) The p-value is ? ≤ > αα Based on this, we should Select an answer accept reject fail to reject the null hypothesis. Thus, the final conclusion is that ... The data suggest the population proportion is not significantly lower than 18% at αα = 0.10, so…arrow_forward
- Only 16% of registered voters voted in the last election. Will voter participation increase for the upcoming election? Of the 328 randomly selected registered voters surveyed, 66 of them will vote in the upcoming election. What can be concluded at the αα = 0.05 level of significance? For this study, we should use Select an answer t-test for a population mean z-test for a population proportion The null and alternative hypotheses would be: H0:H0: ? μ p Select an answer < = > ≠ (please enter a decimal) H1:H1: ? p μ Select an answer = ≠ > < (Please enter a decimal) The test statistic ? t z = (please show your answer to 3 decimal places.) The p-value = (Please show your answer to 4 decimal places.) The p-value is ? ≤ > αα Based on this, we should Select an answer fail to reject reject accept the null hypothesis. Thus, the final conclusion is that ... The data suggest the population proportion is not significantly higher than 16% at αα = 0.05, so…arrow_forwardOnly 18% of registered voters voted in the last election. Will voter participation decline for the upcoming election? Of the 362 randomly selected registered voters surveyed, 62 of them will vote in the upcoming election. What can be concluded at the αα = 0.05 level of significance? For this study, we should use Select an answer t-test for a population mean z-test for a population proportion Correct The null and alternative hypotheses would be: H0:H0: ? p μ Correct Select an answer ≠ < > = Correct (please enter a decimal) H1:H1: ? p μ Correct Select an answer > = < ≠ Correct (Please enter a decimal) The test statistic ? t z Correct = (please show your answer to 3 decimal places.) The p-value = (Please show your answer to 4 decimal places.)arrow_forwardOnly 12% of registered voters voted in the last election. Will voter participation increase for the upcoming election? Of the 351 randomly selected registered voters surveyed, 53 of them will vote in the upcoming election. What can be concluded at the αα = 0.01 level of significance? For this study, we should use Select an answer z-test for a population proportion t-test for a population mean The null and alternative hypotheses would be: H0:H0: ? μ p Select an answer ≠ > = < (please enter a decimal) H1:H1: ? μ p Select an answer > ≠ < = (Please enter a decimal) The test statistic ? z t = (please show your answer to 3 decimal places.) The p-value = (Please show your answer to 4 decimal places.) The p-value is ? > ≤ αα Based on this, we should Select an answer reject accept fail to reject the null hypothesis. Thus, the final conclusion is thatarrow_forward
 MATLAB: An Introduction with ApplicationsStatisticsISBN:9781119256830Author:Amos GilatPublisher:John Wiley & Sons Inc
 Probability and Statistics for Engineering and th...StatisticsISBN:9781305251809Author:Jay L. DevorePublisher:Cengage Learning
 Statistics for The Behavioral Sciences (MindTap C...StatisticsISBN:9781305504912Author:Frederick J Gravetter, Larry B. WallnauPublisher:Cengage Learning
 Elementary Statistics: Picturing the World (7th E...StatisticsISBN:9780134683416Author:Ron Larson, Betsy FarberPublisher:PEARSON
 The Basic Practice of StatisticsStatisticsISBN:9781319042578Author:David S. Moore, William I. Notz, Michael A. FlignerPublisher:W. H. Freeman
 Introduction to the Practice of StatisticsStatisticsISBN:9781319013387Author:David S. Moore, George P. McCabe, Bruce A. CraigPublisher:W. H. Freeman