Statistical Reasoning for Everyday Life, Books a la Carte Edition (5th Edition)
5th Edition
ISBN: 9780134508382
Author: Jeff Bennett, William L. Briggs, Mario F. Triola
Publisher: PEARSON
bartleby

Videos

Textbook Question
Book Icon
Chapter 9, Problem 1CRE

A random sample of 40 quarters minted after 1964 are weighed. The mean weight is 5.639 grams and the standard deviation is 0.062 gram. Assume that we want to use a 0.05 significance level to test the claim that the population of quarters has a mean weight of 5.670 grams, which is the manufacturing specification.

  1. a. What is the null hypothesis?
  2. b. What is the alternative hypothesis?
  3. c. What is the value of the standard score for the sample mean of 5.639 grams?
  4. d. What is the P-value?
  5. e. What do you conclude? (Be sure to address the original claim that the mean weight is 5.670 grams.)
  6. f. Describe a type I error for this test.
  7. g. Describe a type II error for this test.

a.

Expert Solution
Check Mark
To determine

Identify the null hypothesis.

Explanation of Solution

The given information is that the mean weight for a sample of 40 quarters is 5.639 grams and the standard deviation is 0.062 gram.

Here, the claim is that the population of quarters has a mean weight of 5.670 grams. This can be written as μ=5.670 grams.

Therefore, the null hypothesis is H0:μ=5.670 grams.

b.

Expert Solution
Check Mark
To determine

Identify the alternative hypothesis.

Explanation of Solution

Here, the claim is that the population of quarters has a mean weight of 5.670 grams. This can be written as μ=5.670 grams. The complement of the claim is μ5.670 grams.

Therefore, the alternative hypothesis is Ha:μ5.670 grams.

c.

Expert Solution
Check Mark
To determine

Find the value of the standard score for the sample mean of 5.639 grams.

Answer to Problem 1CRE

The value of the standard score for the sample mean of 5.639 grams is –3.16.

Explanation of Solution

Calculation:

Assume that σ=s because the sample size is large.

The formula for standard score is,

z=x¯μσn

Substitute x¯=5.639, μ=5.670, σ=0.062 and n=40 in the standard score.

z=5.6395.6700.06240=0.031(0.0626.3246)=0.0310.0098=3.16

Thus, the value of the standard score is –3.16.

d.

Expert Solution
Check Mark
To determine

Find the P-value.

Answer to Problem 1CRE

The P-value is 0.001578.

Explanation of Solution

Calculation:

P-value:

Software procedure:

Step-by-step software procedure to obtain P-value using EXCEL is as follows:

  • Open an EXCEL file.
  • In cell A1, enter the formula “=NORM.S.DIST(–3.16,1)”.
  • Output using Excel software is given below:

Statistical Reasoning for Everyday Life, Books a la Carte Edition (5th Edition), Chapter 9, Problem 1CRE

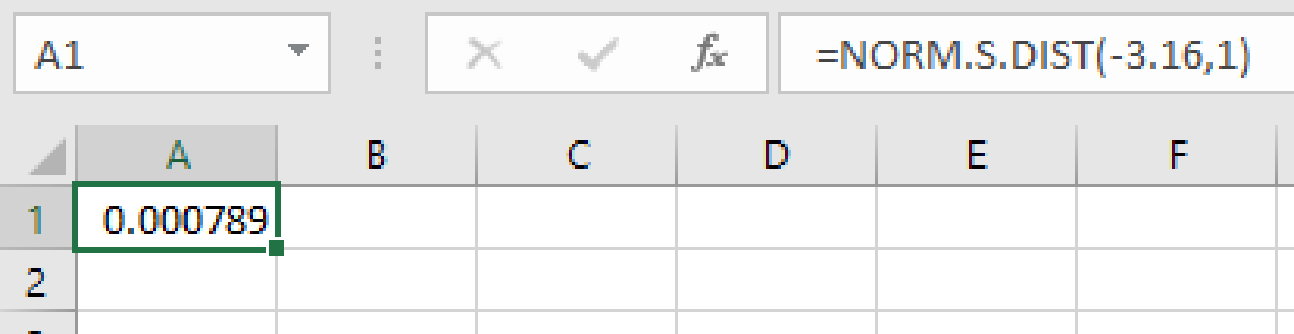
From the output, the P-value for two tailed test is 2×0.000789=0.001578.

e.

Expert Solution
Check Mark
To determine

State the conclusion.

Answer to Problem 1CRE

There is enough evidence to reject the claim that the population of quarters has a mean weight of 5.670 grams.

Explanation of Solution

Decision rule:

If P-valueα, then reject the null hypothesis.

Conclusion:

Here, the P-value is less than the level of significance.

That is, P-value(=0.001578)<α(=0.05)

Therefore, the null hypothesis is rejected.

Hence, there is enough evidence to reject the claim that the population of quarters has a mean weight of 5.670 grams.

f.

Expert Solution
Check Mark
To determine

Describe a type I error.

Explanation of Solution

Type I error: Reject the null hypothesis, when it is actually true.

A Type I error occurs when the hypotheses test indicates that the mean weight differs from 5.670 grams. However, in reality, the mean weight is 5.670 grams.

g.

Expert Solution
Check Mark
To determine

Describe a type II error.

Explanation of Solution

Type II error: Fail to reject the null hypothesis, when it is false.

A Type II error occurs when the hypotheses test indicates that the mean weight is 5.670 grams. However, in reality, the mean weight differs from 5.670 grams.

Want to see more full solutions like this?

Subscribe now to access step-by-step solutions to millions of textbook problems written by subject matter experts!

Chapter 9 Solutions

Statistical Reasoning for Everyday Life, Books a la Carte Edition (5th Edition)

Ch. 9.1 - Prob. 11ECh. 9.1 - Does It Make Sense? For Exercises 512, determine...Ch. 9.1 - What Is Significant? In testing a method of gender...Ch. 9.1 - What Is Significant? In testing a method of gender...Ch. 9.1 - Formulating Hypotheses. In Exercises 1522, state...Ch. 9.1 - Formulating Hypotheses. In Exercises 1522, state...Ch. 9.1 - Formulating Hypotheses. In Exercises 1522, state...Ch. 9.1 - Formulating Hypotheses. In Exercises 1522, state...Ch. 9.1 - Prob. 19ECh. 9.1 - Formulating Hypotheses. In Exercises 1522, state...Ch. 9.1 - Formulating Hypotheses. In Exercises 1522, state...Ch. 9.1 - Formulating Hypotheses. In Exercises 1522, state...Ch. 9.1 - Drawing a Conclusion from a Hypothesis Test. If we...Ch. 9.1 - Drawing a Conclusion from a Hypothesis Test. If we...Ch. 9.1 - Drawing a Conclusion from a Hypothesis Test. If we...Ch. 9.1 - Drawing a Conclusion from a Hypothesis Test. If we...Ch. 9.1 - Drawing a Conclusion from a Hypothesis Test. If we...Ch. 9.1 - Drawing a Conclusion from a Hypothesis Test. If we...Ch. 9.2 - Notation. Briefly describe what each of the...Ch. 9.2 - Standard Score. When testing a claim about a...Ch. 9.2 - Critical Values. What do we mean by critical...Ch. 9.2 - Prob. 4ECh. 9.2 - Prob. 5ECh. 9.2 - Prob. 6ECh. 9.2 - Does It Make Sense? For Exercises 512, determine...Ch. 9.2 - Prob. 8ECh. 9.2 - Prob. 9ECh. 9.2 - Prob. 10ECh. 9.2 - Prob. 11ECh. 9.2 - Prob. 12ECh. 9.2 - Using Critical Values to Reject or Not Reject. In...Ch. 9.2 - Using Critical Values to Reject or Not Reject. In...Ch. 9.2 - Using Critical Values to Reject or Not Reject. In...Ch. 9.2 - Using Critical Values to Reject or Not Reject. In...Ch. 9.2 - Using Critical Values to Reject or Not Reject. In...Ch. 9.2 - Using Critical Values to Reject or Not Reject. In...Ch. 9.2 - Using Critical Values to Reject or Not Reject. In...Ch. 9.2 - Using Critical Values to Reject or Not Reject. In...Ch. 9.2 - Using P-Values to Reject or Not Reject. In...Ch. 9.2 - Using P-Values to Reject or Not Reject. In...Ch. 9.2 - Using P-Values to Reject or Not Reject. In...Ch. 9.2 - Using P-Values to Reject or Not Reject. In...Ch. 9.2 - Using P-Values to Reject or Not Reject. In...Ch. 9.2 - Using P-Values to Reject or Not Reject. In...Ch. 9.2 - Prob. 27ECh. 9.2 - Prob. 28ECh. 9.2 - Using P-Values to Reject or Not Reject. In...Ch. 9.2 - Prob. 30ECh. 9.2 - Prob. 31ECh. 9.2 - Prob. 32ECh. 9.2 - Prob. 33ECh. 9.2 - Prob. 34ECh. 9.2 - Hypothesis Tests for Means. For Exercises 3548,...Ch. 9.2 - Hypothesis Tests for Means. For Exercises 3548,...Ch. 9.2 - Hypothesis Tests for Means. For Exercises 3548,...Ch. 9.2 - Prob. 38ECh. 9.2 - Hypothesis Tests for Means. For Exercises 3548,...Ch. 9.2 - Hypothesis Tests for Means. For Exercises 3548,...Ch. 9.2 - Prob. 41ECh. 9.2 - Hypothesis Tests for Means. For Exercises 3548,...Ch. 9.2 - Hypothesis Tests for Means. For Exercises 3548,...Ch. 9.2 - Prob. 44ECh. 9.2 - Prob. 45ECh. 9.2 - Prob. 46ECh. 9.2 - Prob. 47ECh. 9.2 - Prob. 48ECh. 9.2 - Prob. 49ECh. 9.2 - Type I and Type II Errors. In Exercises 4952, a...Ch. 9.2 - Prob. 51ECh. 9.2 - Prob. 52ECh. 9.3 - Notation. What do n, p, p, and P-value represent?Ch. 9.3 - Standard Score. When testing a claim about a...Ch. 9.3 - Prob. 3ECh. 9.3 - P-Value. A P-value of 0.00001 is obtained when...Ch. 9.3 - Prob. 5ECh. 9.3 - Prob. 6ECh. 9.3 - Prob. 7ECh. 9.3 - Does It Make Sense? For Exercises 59, determine...Ch. 9.3 - Prob. 9ECh. 9.3 - Hypothesis Tests for Population Proportions. For...Ch. 9.3 - Prob. 11ECh. 9.3 - Hypothesis Tests for Population Proportions. For...Ch. 9.3 - Hypothesis Tests for Population Proportions. For...Ch. 9.3 - Hypothesis Tests for Population Proportions. For...Ch. 9.3 - Hypothesis Tests for Population Proportions. For...Ch. 9.3 - Prob. 16ECh. 9.3 - Prob. 17ECh. 9.3 - Hypothesis Tests for Population Proportions. For...Ch. 9.3 - Hypothesis Tests for Population Proportions. For...Ch. 9.3 - Hypothesis Tests for Population Proportions. For...Ch. 9.3 - Hypothesis Tests for Population Proportions. For...Ch. 9 - A random sample of 40 quarters minted after 1964...Ch. 9 - In a study of smokers who tried to quit smoking...Ch. 9 - Finding a Job Through Networking. In a survey of...Ch. 9 - A medical student wants to test the claim that...Ch. 9 - Identify the null and alternative hypotheses for...Ch. 9 - Identify the null and alternate hypotheses for...Ch. 9 - Identify the null and alternative hypotheses for...Ch. 9 - Prob. 4CQCh. 9 - Prob. 5CQCh. 9 - Prob. 6CQCh. 9 - In Exercises 510, assume that we want to use a...Ch. 9 - Prob. 8CQCh. 9 - In Exercises 510, assume that we want to use a...Ch. 9 - Prob. 10CQ
Knowledge Booster
Background pattern image
Statistics
Learn more about
Need a deep-dive on the concept behind this application? Look no further. Learn more about this topic, statistics and related others by exploring similar questions and additional content below.
Recommended textbooks for you
Text book image
MATLAB: An Introduction with Applications
Statistics
ISBN:9781119256830
Author:Amos Gilat
Publisher:John Wiley & Sons Inc
Text book image
Probability and Statistics for Engineering and th...
Statistics
ISBN:9781305251809
Author:Jay L. Devore
Publisher:Cengage Learning
Text book image
Statistics for The Behavioral Sciences (MindTap C...
Statistics
ISBN:9781305504912
Author:Frederick J Gravetter, Larry B. Wallnau
Publisher:Cengage Learning
Text book image
Elementary Statistics: Picturing the World (7th E...
Statistics
ISBN:9780134683416
Author:Ron Larson, Betsy Farber
Publisher:PEARSON
Text book image
The Basic Practice of Statistics
Statistics
ISBN:9781319042578
Author:David S. Moore, William I. Notz, Michael A. Fligner
Publisher:W. H. Freeman
Text book image
Introduction to the Practice of Statistics
Statistics
ISBN:9781319013387
Author:David S. Moore, George P. McCabe, Bruce A. Craig
Publisher:W. H. Freeman
Hypothesis Testing using Confidence Interval Approach; Author: BUM2413 Applied Statistics UMP;https://www.youtube.com/watch?v=Hq1l3e9pLyY;License: Standard YouTube License, CC-BY
Hypothesis Testing - Difference of Two Means - Student's -Distribution & Normal Distribution; Author: The Organic Chemistry Tutor;https://www.youtube.com/watch?v=UcZwyzwWU7o;License: Standard Youtube License