
Videos
State the P–value for each test by performing a test of the null hypothesis that the group means or group proportions are equal versus the alternative that they are not equal.
Answer to Problem 1CS
The P–value for the each test is as follows:
| Characteristic | P–value |
| Age | 0.057 |
| Systolic blood pressure | 0.000 |
| Diastolic blood pressure | 0.037 |
| Treatment for hypertension | 0.819 |
| Atrial fibrillation | 0.337 |
| Diabetes | 0.875 |
| Cigarette smoking | 0.343 |
| Coronary bypass surgery | 0.762 |
Explanation of Solution
Calculation:
The data represents the means and standard deviations corresponding to three characteristics of standard treatment and new treatment.
Furthermore, the data corresponding to the percentage with the characteristics for the 5 characteristics for standard treatment and new treatment is given.
Here, it is given that the
Let
Hypothesis test for the variable “Age”:
The hypotheses are given below:
Null hypothesis:
That is, there is no significant difference between the mean age of new treatment and standard treatment.
Alternate hypothesis:
That is, there is a significant difference between the mean age of new treatment and standard treatment.
P-value:
Software Procedure:
Step by step procedure to perform hypothesis test for the difference between the two populations means using the MINITAB software:
- Choose Stat > Basic Statistics > 2-Sample t.
- Choose Summarized data.
- In first sample, enter the sample size as 731, sample mean as 64 and sample standard deviation as 11.
- In second sample, enter the sample size as 1,089, sample mean as 65 and sample standard deviation as 11.
- Choose Options.
- In Confidence level, enter 95.
- Enter 0 in Hypothesized value.
- In Alternative, select not equal to
- Click OK in all the dialogue boxes.
Output using the MINITAB software is given below:
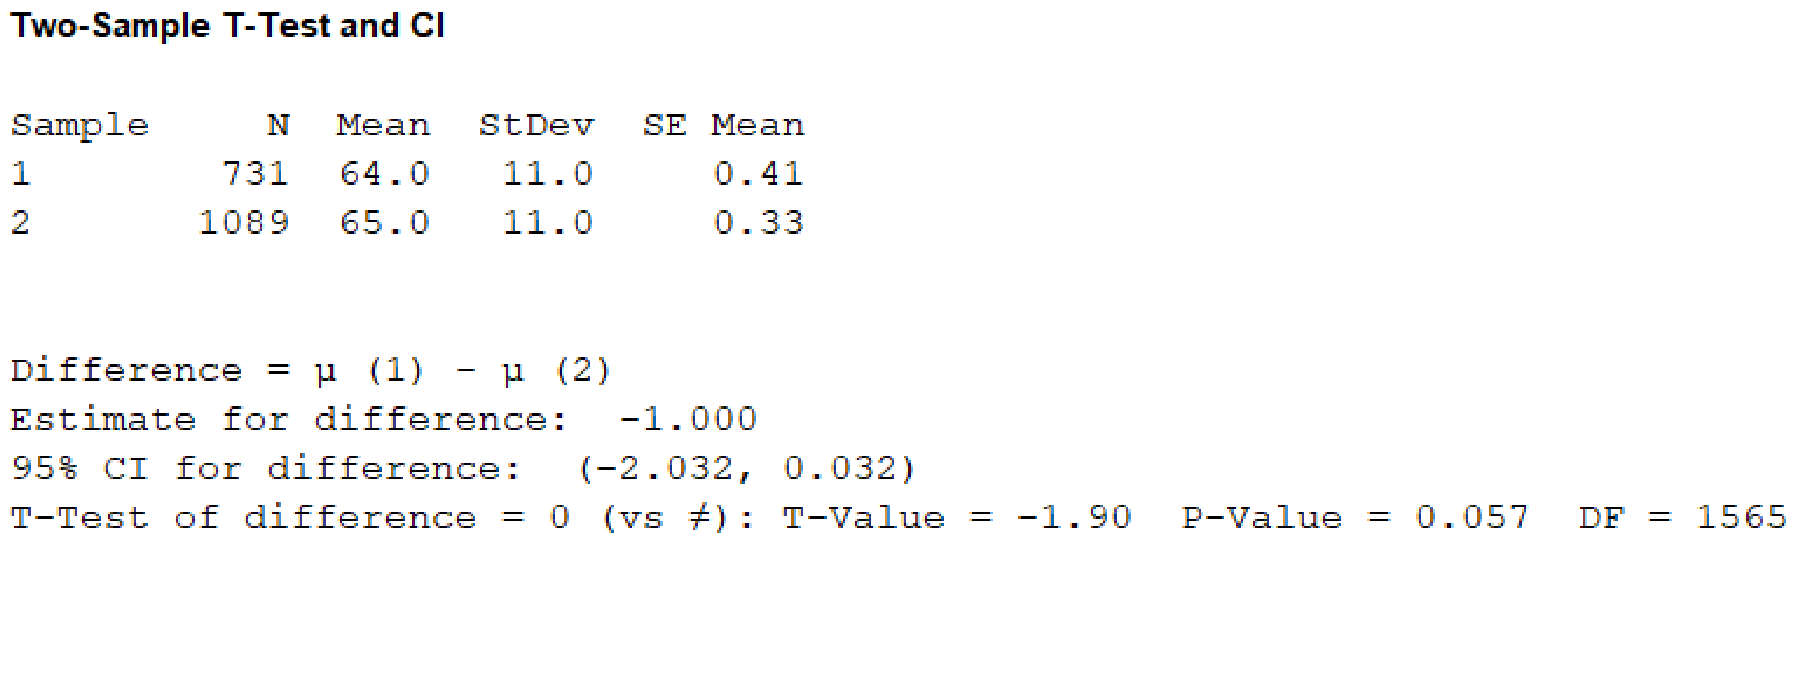
From, the MINITAB output the P-value corresponding to the variable “Age” is 0.057.
Hypothesis test for the variable “Systolic blood pressure”:
The hypotheses are given below:
Null hypothesis:
That is, there is no significant difference between the mean systolic blood pressure of new treatment and standard treatment.
Alternate hypothesis:
That is, there is a significant difference between the mean systolic blood pressure of new treatment and standard treatment.
P-value:
Software Procedure:
Step by step procedure to perform hypothesis test for the difference between the two population means using the MINITAB software:
- Choose Stat > Basic Statistics > 2-Sample t.
- Choose Summarized data.
- In first sample, enter the sample size as 731, sample mean as 121 and sample standard deviation as 18.
- In second sample, enter the sample size as 1,089, sample mean as 124 and sample standard deviation as 17.
- Choose Options.
- In Confidence level, enter 95.
- Enter 0 in Hypothesized value.
- In Alternative, select not equal to
- Click OK in all the dialogue boxes.
Output using the MINITAB software is given below:
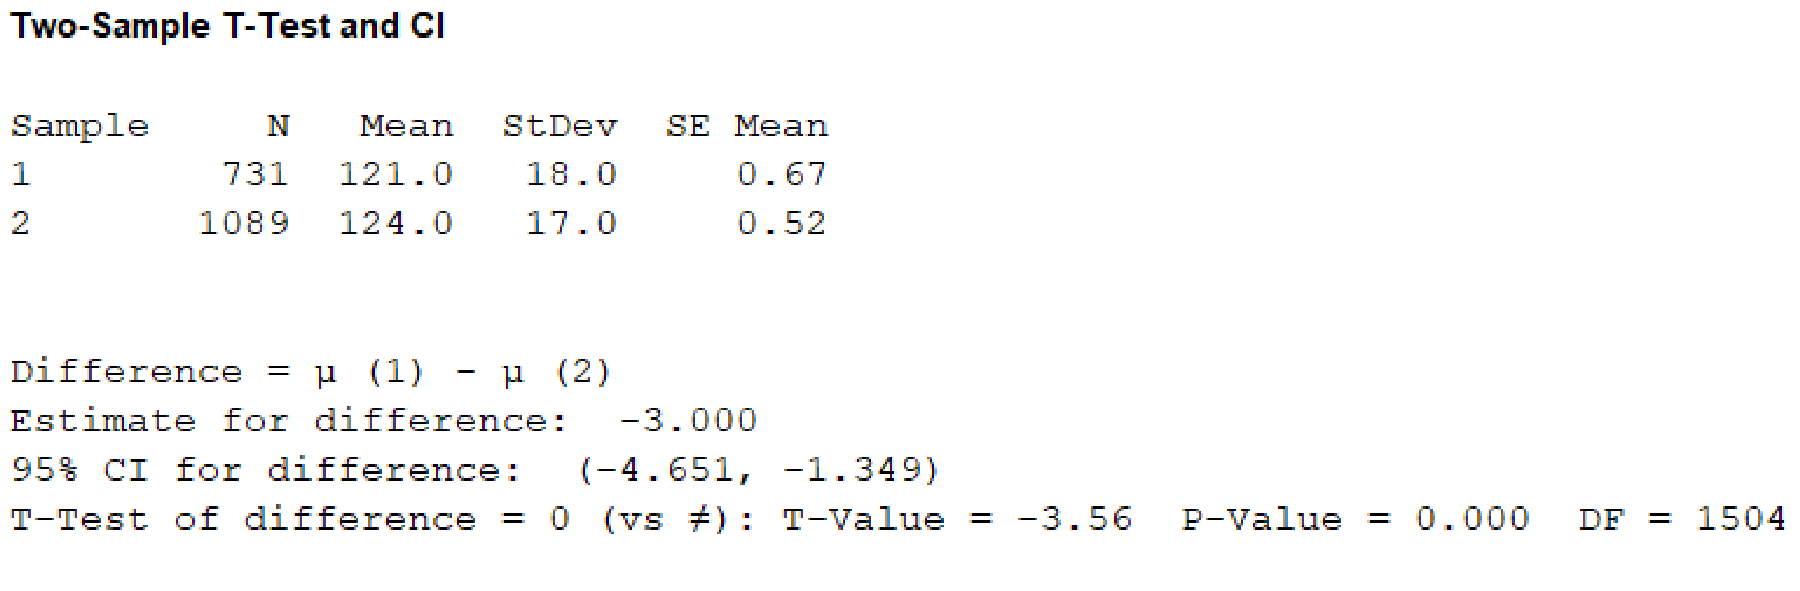
From, the MINITAB output the P-value corresponding to the variable “Systolic blood pressure” is 0.000.
Hypothesis test for the variable “Diastolic blood pressure”:
The hypotheses are given below:
Null hypothesis:
That is, there is no significant difference between the mean diastolic blood pressure of new treatment and standard treatment.
Alternate hypothesis:
That is, there is a significant difference between the mean diastolic blood pressure of new treatment and standard treatment.
P-value:
Software Procedure:
Step by step procedure to perform hypothesis test for the difference between the two populations means using the MINITAB software:
- Choose Stat > Basic Statistics > 2-Sample t.
- Choose Summarized data.
- In first sample, enter the sample size as 731, sample mean as 71 and sample standard deviation as 10.
- In second sample, enter the sample size as 1,089, sample mean as 72 and sample standard deviation as 10.
- Choose Options.
- In Confidence level, enter 95.
- Enter 0 in Hypothesized value.
- In Alternative, select not equal to
- Click OK in all the dialogue boxes.
Output using the MINITAB software is given below:
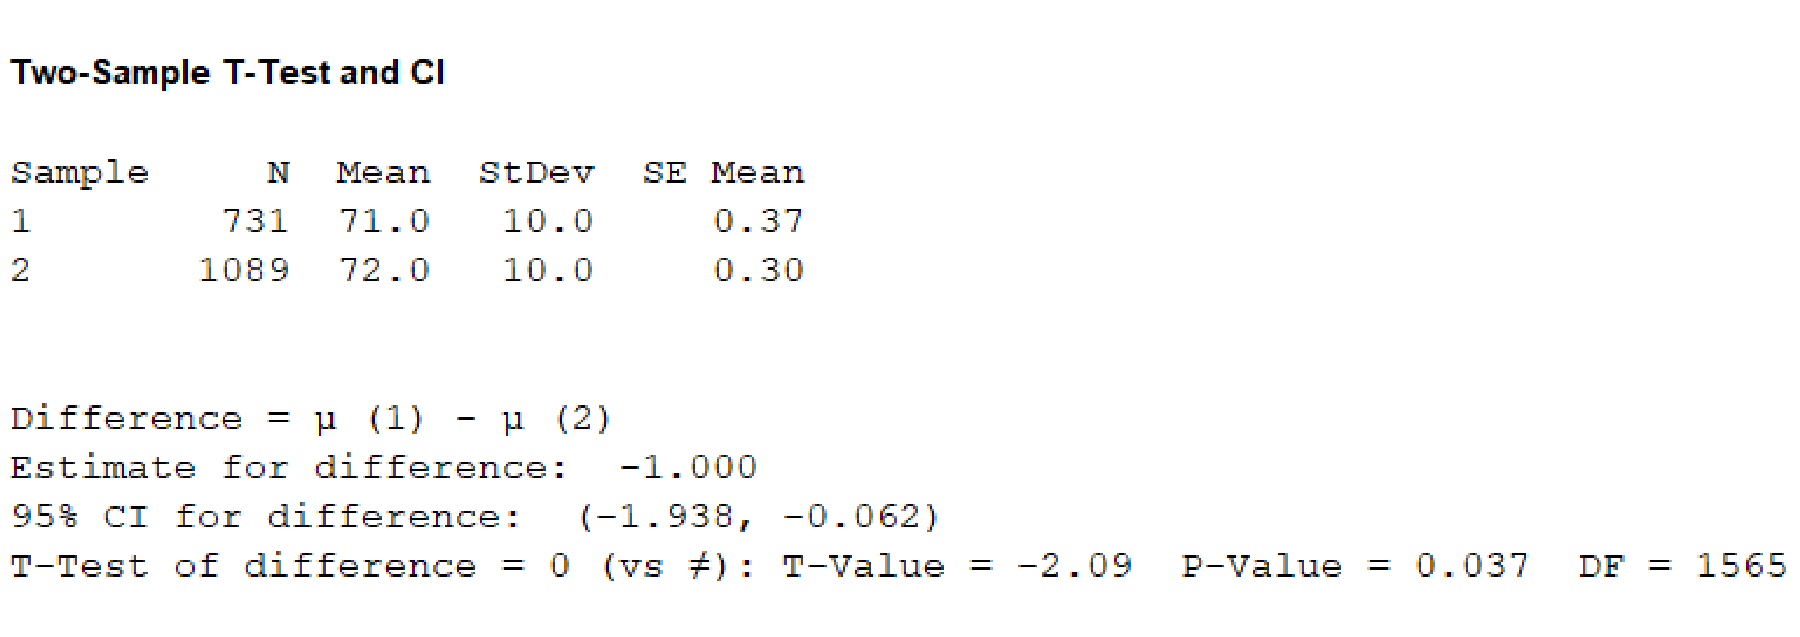
From, the MINITAB output the P-value corresponding to the variable “Diastolic blood pressure” is 0.037.
Hypothesis test for the variable “Treatment for hypertension”:
The sample size of standard treatment is
Hence, the specified characteristics of treatment for hypertension under new treatment is
The sample size of new treatment is
Hence, the specified characteristics of treatment for hypertension under new treatment is
The hypotheses are given below:
Null hypothesis:
That is, there is no significant difference between the proportion of treatment for hypertension under new treatment and standard treatment.
Alternate hypothesis:
That is, there is a significant difference between the proportion of treatment for hypertension under new treatment and standard treatment.
P-value:
Software Procedure:
Step by step procedure to perform hypothesis test for the difference between the two population proportions using the MINITAB software:
- Choose Stat > Basic Statistics > 2-Proportions.
- Choose Summarized data.
- In first sample, enter the number of trials as 731 and number of events as 462.
- In second sample, enter the number of trials as 1,089 and number of events as 694.
- Choose Options.
- In Confidence level, enter 95.
- Enter 0 in Hypothesized value.
- In Alternative, select not equal to
- Click OK in all the dialogue boxes.
Output using the MINITAB software is given below:
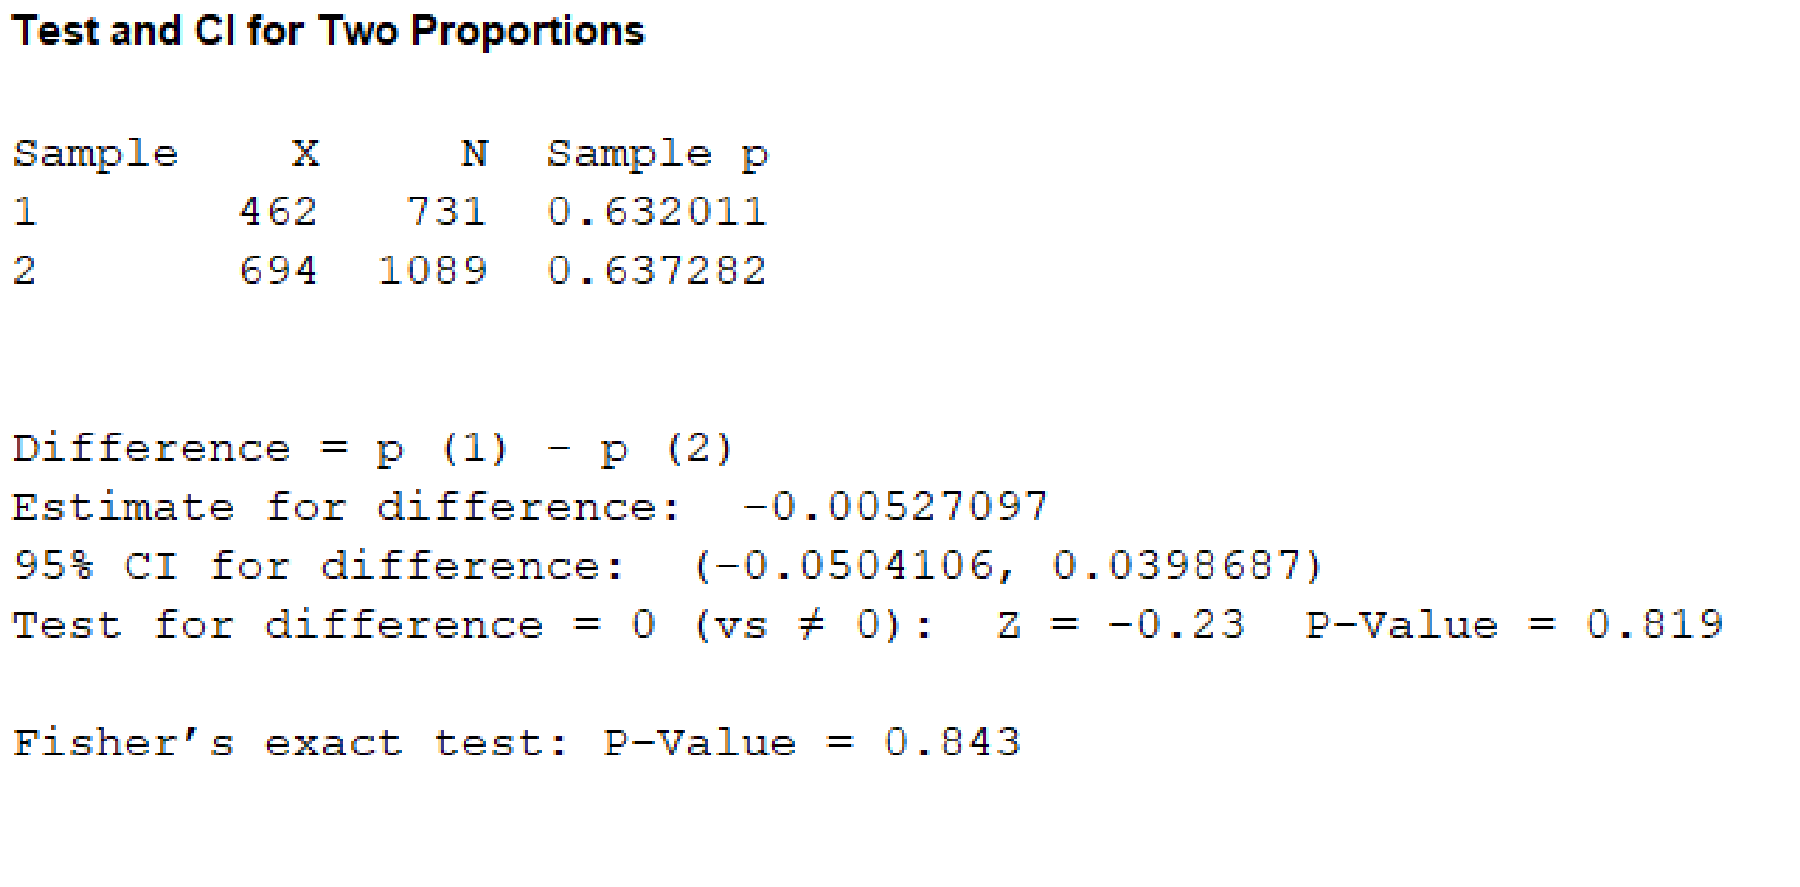
From, the MINITAB output the P-value corresponding to the variable “Treatment for hyper tension” is 0.819.
Hypothesis test for the variable “Atrial fibrillation”:
The sample size of standard treatment is
Hence, the specified characteristics of treatment for Atrial fibrillation under standard treatment is
The sample size of new treatment is
Hence, the specified characteristics of Atrial fibrillation under new treatment is
The hypotheses are given below:
Null hypothesis:
That is, there is no significant difference between the proportion of Atrial fibrillation under new treatment and standard treatment.
Alternate hypothesis:
That is, there is a significant difference between the proportion of Atrial fibrillation under new treatment and standard treatment.
P-value:
Software Procedure:
Step by step procedure to perform hypothesis test for the difference between the two populationproportions using the MINITAB software:
- Choose Stat > Basic Statistics > 2-Proportions.
- Choose Summarized data.
- In first sample, enter the number of trials as 731 and number of events as 92.
- In second sample, enter the number of trials as 1,089 and number of events as 121.
- Choose Options.
- In Confidence level, enter 95.
- Enter 0 in Hypothesized value.
- In Alternative, select not equal to
- Click OK in all the dialogue boxes.
Output using the MINITAB software is given below:
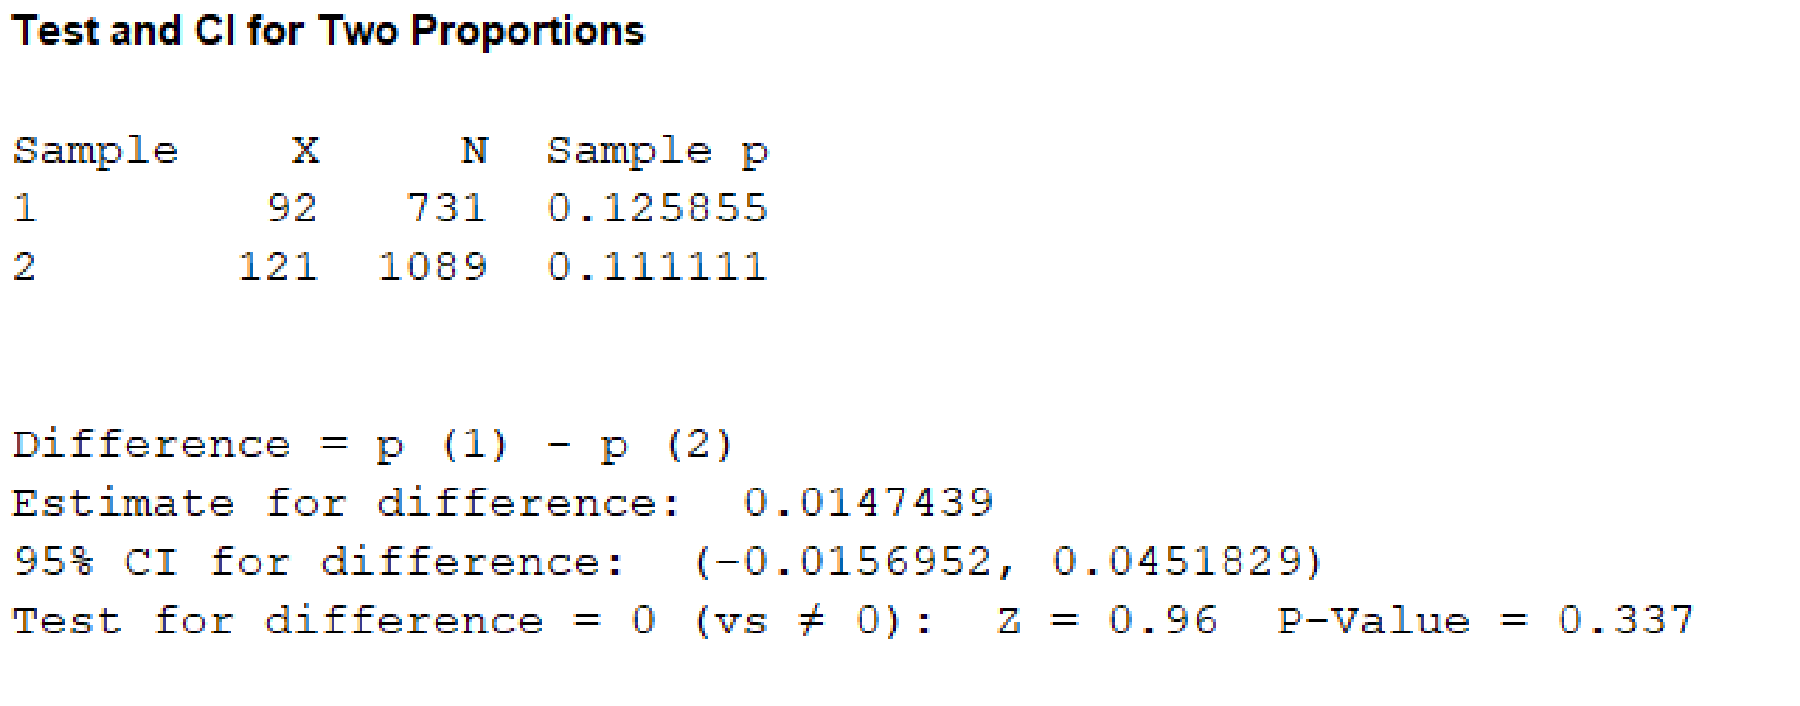
From, the MINITAB output the P-value corresponding to the variable “Atrial fibrillation” is 0.337.
Hypothesis test for the variable “Diabetes”:
The sample size of standard treatment is
Hence, the specified characteristics of diabetes under standard treatment is
The sample size of new treatment is
Hence, the specified characteristics of diabetes under new treatment is
The hypotheses are given below:
Null hypothesis:
That is, there is no significant difference between the proportion of Diabetes under new treatment and standard treatment.
Alternate hypothesis:
That is, there is a significant difference between the proportion of Diabetes under new treatment and standard treatment.
P-value:
Software Procedure:
Step by step procedure to perform hypothesis test for the difference between the two populationproportions using the MINITAB software:
- Choose Stat > Basic Statistics > 2-Proportions.
- Choose Summarized data.
- In first sample, enter the number of trials as 731 and number of events as 221.
- In second sample, enter the number of trials as 1,089 and number of events as 333.
- Choose Options.
- In Confidence level, enter 95.
- Enter 0 in Hypothesized value.
- In Alternative, select not equal to
- Click OK in all the dialogue boxes.
Output using the MINITAB software is given below:
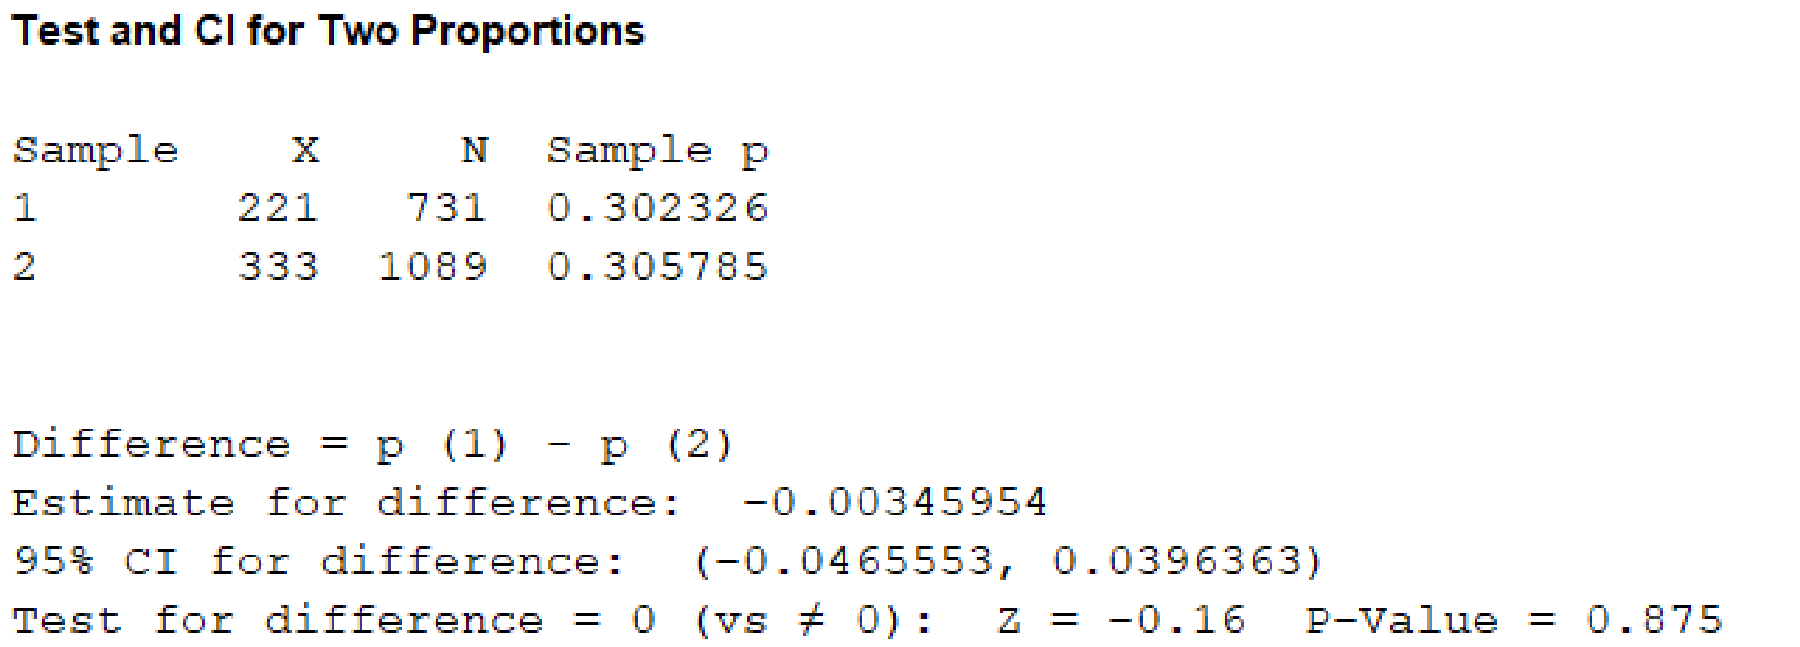
From, the MINITAB output the P-value corresponding to the variable “Diabetes” is 0.875.
Hypothesis test for the variable “Cigarette smoking”:
The sample size of standard treatment is
Hence, the specified characteristics of cigarette smoking under standard treatment is
The sample size of new treatment is
Hence, the specified characteristics of cigarette smoking under new treatment is
The hypotheses are given below:
Null hypothesis:
That is, there is no significant difference between the proportion of Cigarette smoking under new treatment and standard treatment.
Alternate hypothesis:
That is, there is a significant difference between the proportion of Cigarette smoking under new treatment and standard treatment.
P-value:
Software Procedure:
Step by step procedure to perform hypothesis test for the difference between the two populationsproportions using the MINITAB software:
- Choose Stat > Basic Statistics > 2-Proportions.
- Choose Summarized data.
- In first sample, enter the number of trials as 731 and number of events as 94.
- In second sample, enter the number of trials as 1,089 and number of events as 124.
- Choose Options.
- In Confidence level, enter 95.
- Enter 0 in Hypothesized value.
- In Alternative, select not equal to
- Click OK in all the dialogue boxes.
Output using the MINITAB software is given below:

From, the MINITAB output the P-value corresponding to the variable “Cigarette smoking” is 0.343.
Hypothesis test for the variable “Coronary bypass surgery”:
The sample size of standard treatment is
Hence, the specified characteristics of Coronary bypass surgery under standard treatment is
The sample size of new treatment is
Hence, the specified characteristics of coronary bypass surgery under new treatment is
The hypotheses are given below:
Null hypothesis:
That is, there is no significant difference between the proportion of Coronary bypass surgery under new treatment and standard treatment.
Alternate hypothesis:
That is, there is a significant difference between the proportion of Coronary bypass surgery under new treatment and standard treatment.
P-value:
Software Procedure:
Step by step procedure to perform hypothesis test for the difference between the two populationproportions using the MINITAB software:
- Choose Stat > Basic Statistics > 2-Proportions.
- Choose Summarized data.
- In first sample, enter the number of trials as 1,089 and number of events as 317.
- In second sample, enter the number of trials as 731 and number of events as 208.
- Choose Options.
- In Confidence level, enter 95.
- Enter 0 in Hypothesized value.
- In Alternative, select not equal to
- Click OK in all the dialogue boxes.
Output using the MINITAB software is given below:
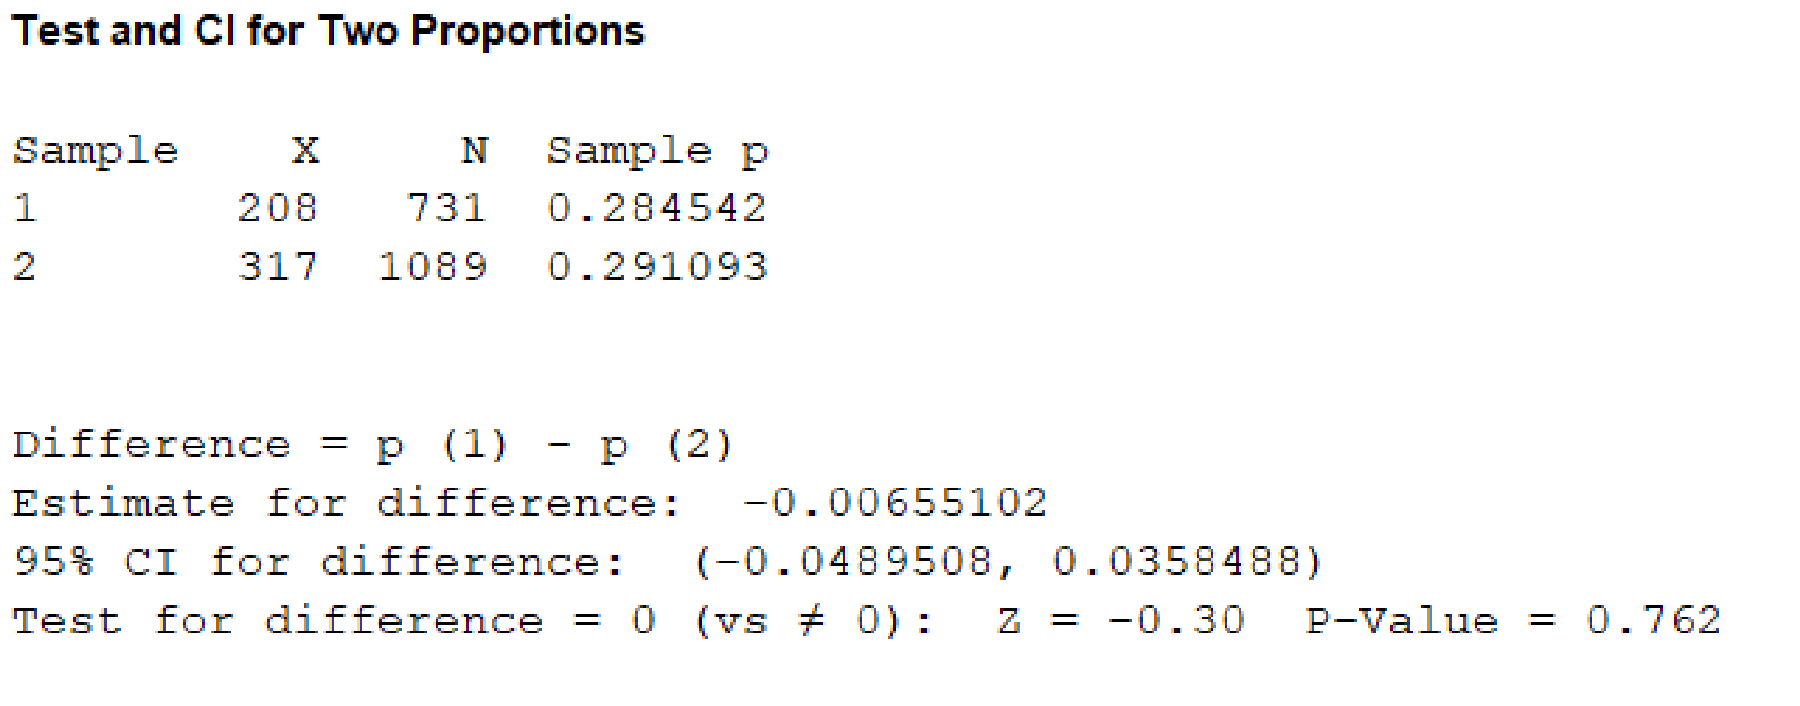
From, the MINITAB output the P-value corresponding to the variable “Coronary bypass surgery” is 0.762.
Want to see more full solutions like this?
Chapter 9 Solutions
Essential Statistics


 MATLAB: An Introduction with ApplicationsStatisticsISBN:9781119256830Author:Amos GilatPublisher:John Wiley & Sons Inc
 Probability and Statistics for Engineering and th...StatisticsISBN:9781305251809Author:Jay L. DevorePublisher:Cengage Learning
 Statistics for The Behavioral Sciences (MindTap C...StatisticsISBN:9781305504912Author:Frederick J Gravetter, Larry B. WallnauPublisher:Cengage Learning
 Elementary Statistics: Picturing the World (7th E...StatisticsISBN:9780134683416Author:Ron Larson, Betsy FarberPublisher:PEARSON
 The Basic Practice of StatisticsStatisticsISBN:9781319042578Author:David S. Moore, William I. Notz, Michael A. FlignerPublisher:W. H. Freeman
 Introduction to the Practice of StatisticsStatisticsISBN:9781319013387Author:David S. Moore, George P. McCabe, Bruce A. CraigPublisher:W. H. Freeman