
Financial And Managerial Accounting
15th Edition
ISBN: 9781337902663
Author: WARREN, Carl S.
Publisher: Cengage Learning,
expand_more
expand_more
format_list_bulleted
Videos
Textbook Question
Chapter 9, Problem 1MAD
Compare Amazon.com to Netflix
Amazon.com, Inc. (AMZN) is the world’s leading Internet retailer of merchandise and media. Amazon also designs and sells electronic products, such as e-readers. Netflix, Inc. (NFLX) is one of the world’s leading Internet television networks. Both companies compete in the digital media and streaming space. However, Netflix is more narrowly focused in the digital streaming business than is Amazon.
Sales and average book value of fixed assets information (in millions) are provided for Amazon and Netflix for a recent year as follows:
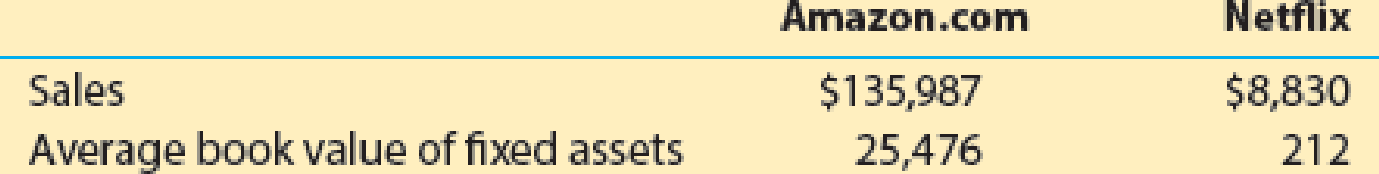
- a. Compute the fixed asset turnover ratio for each company. Round to one decimal place.
- b. Which company is more efficient in generating sales from fixed assets?
- c. Interpret your results.
Expert Solution & Answer
Want to see the full answer?
Check out a sample textbook solution
Students have asked these similar questions
Analyze and compare Amazon.com, Best Buy, and Wal-Mart
Amazon.com, Inc. (AMZN) is one of the largest Internet retailers in the world. Best Buy Co., Inc. (BBY) is a leading retailer of consumer electronics and media products in the United States, while Wal-Mart Stores, Inc. (WMT) is the leading retailer in the United States. Amazon, Best Buy, and Wal-Mart compete in similar markets. Best Buy and Wal-Mart sell through both traditional retail stores and the Internet, while Amazon sells only through the internet. Sales and cash flow information from recent annual reports for all three companies is as follows (in millions):
Amazon
Best Buy
Wal-Mart
Sales
$135,987
$39,403
$485,873
Cash flows from operating activities
16,443
2,545
31,530
Purchases of property, plant, and equipment
(6,737)
(582)
(10,619)
a. Determine the free cash flow for all three companies.
Amazon:
Best Buy:
Wal-Mart:
b. Compute the ratio of free cash flow to sales for all three companies. Round percentages…
Analyze and compare Amazon.com and Wal-Mart
Amazon.com, Inc. (AMZN) is one of the largest internet retailers in the world. Wal-Mart Stores, Inc. (WMT) is the largest retailer in the United States. Amazon and Wal-Mart compete in similar markets; however, Wal-Mart sells through both traditional retail stores and the internet, while Amazon sells only through the internet. Interest expense and income before income tax expense from the financial statements of both companies for two recent years follow (in millions):
Amazon
Walmart
Year 2
Year 1
Year 2
Year 1
Interest expense
$484
$459
$2,548
$2,461
Income (loss) before income tax expense
3,892
1,568
21,638
24,799
a. Compute the times interest earned ratio for both companies for the two years. Round your answers to one decimal place.
Amazon
Walmart
Year 2
Year 1
Year 2
Year 1
Times Interest Earned Ratio
Cost Structure of Retailers; The Internet; Operating Leverage Today’s retailers are findingthat online sales and service are a necessary ingredient of their overall marketing and selling strategybecause of increased competition. In certain retail sectors, consumers are moving to the Internet inlarge numbers for convenience and selection. Unfortunately, the investment in resources, both equipment and labor, can be huge. Some studies show that less than a third of online retailers are profitableon internet sales. As a result, some new consulting firms, software firms, and service providers havebegun to provide e-commerce solutions for retailers.Required1. How does a consulting firm, service provider, or software firm help a retailer reduce costs and becomemore competitive for internet sales? What is the role of operating leverage in the retailer’s decision tooutsource online sales and service?2. Cost structure is not the only thing management should be concerned about when moving in to…
Chapter 9 Solutions
Financial And Managerial Accounting
Ch. 9 - ONeil Office Supplies has a fleet of automobiles...Ch. 9 - Prob. 2DQCh. 9 - Prob. 3DQCh. 9 - Prob. 4DQCh. 9 - Prob. 5DQCh. 9 - Keyser Company purchased a machine that has a...Ch. 9 - Prob. 7DQCh. 9 - A. Under what conditions is the use of an...Ch. 9 - Prob. 9DQCh. 9 - Prob. 10DQ
Ch. 9 - Straight-line depreciation A building acquired at...Ch. 9 - Units-of-activity depreciation A truck acquired at...Ch. 9 - Double-declining-balance depreciation A building...Ch. 9 - Revision of depreciation Equipment with a cost of...Ch. 9 - Capital and revenue expenditures On February 14,...Ch. 9 - Sale of equipment Equipment was acquired at the...Ch. 9 - Prob. 7BECh. 9 - Prob. 8BECh. 9 - Fixed asset turnover ratio Select financial...Ch. 9 - Costs of acquiring fixed assets Melinda Stoffers...Ch. 9 - Prob. 2ECh. 9 - Prob. 3ECh. 9 - Nature of depreciation Tri-City Ironworks Co....Ch. 9 - Straight-line depreciation rates Convert each of...Ch. 9 - Straight-line depreciation A refrigerator used by...Ch. 9 - Depreciation by units-of-activity method A...Ch. 9 - Depreciation by units-of-activity method Prior to...Ch. 9 - Depreciation by two methods A Kubota tractor...Ch. 9 - Depreciation by two methods A storage tank...Ch. 9 - Partial-year depreciation Equipment acquired at a...Ch. 9 - Revision of depreciation A building with a cost of...Ch. 9 - Prob. 13ECh. 9 - Prob. 14ECh. 9 - Prob. 15ECh. 9 - Capital expenditure and depreciation Willow Creek...Ch. 9 - Entries for sale of fixed asset Equipment acquired...Ch. 9 - Disposal of fixed asset Equipment acquired on...Ch. 9 - Prob. 19ECh. 9 - Kleen Company acquired patent rights on January 10...Ch. 9 - Prob. 21ECh. 9 - Prob. 22ECh. 9 - Asset traded for similar asset A printing press...Ch. 9 - Prob. 24ECh. 9 - Prob. 25ECh. 9 - Prob. 26ECh. 9 - Prob. 1PACh. 9 - Comparing three depreciation methods Dexter...Ch. 9 - Depreciation by three methods; partial years...Ch. 9 - Depreciation by two methods; sale of fixed asset...Ch. 9 - Transactions for fixed assets, including sale The...Ch. 9 - Prob. 6PACh. 9 - Prob. 1PBCh. 9 - Comparing three depreciation methods Waylander...Ch. 9 - Depreciation by three methods; partial years...Ch. 9 - Depreciation by two methods; sale of fixed asset...Ch. 9 - Transactions for fixed assets, including sale The...Ch. 9 - Prob. 6PBCh. 9 - Compare Amazon.com to Netflix Amazon.com, Inc....Ch. 9 - Prob. 2MADCh. 9 - Prob. 3MADCh. 9 - Compare Fed Ex and UPS FedEx Corporation (FDX) and...Ch. 9 - Prob. 5MADCh. 9 - Revising depreciation estimates Hard Bodies Co. is...Ch. 9 - Communication Godwin Co. owns three delivery...Ch. 9 - Prob. 4TIF
Knowledge Booster


Learn more about
Need a deep-dive on the concept behind this application? Look no further. Learn more about this topic, accounting and related others by exploring similar questions and additional content below.Similar questions
- Amazon.com, Inc. (AMZN) is one of the largest Internet retailers in the world. Target Corporation (TGT) is one of the largest value-priced general merchandisers operating in the United States. Target sells through nearly 1,800 brick-and-mortar stores and through the Internet. Amazon and Target compete for customers across a wide variety of products, including media, general merchandise, apparel, and consumer electronics. Cost of goods sold and inventory information from a recent annual report are provided for both companies as follows (in millions): a. Compute the inventory turnover for both companies. Round all calculations to one decimal place. b. Compute the number of days sales in inventory for both companies. Use 365 days and round all calculations to one decimal place. c. Which company has the better inventory efficiency? d. What might explain the difference in inventory efficiency between the two companies?arrow_forwardAmazon.com, Inc. is the worlds leading Internet retailer of merchandise and media. Amazon also designs and sells electronic products, such as e-readers. Netflix, Inc. is the worlds leading Internet television network. Both companies compete in the digital media and streaming space. However, Netflix is more narrowly focused in the digital streaming business than is Amazon. Sales and average book value of fixed assets information (in millions) are provided for Amazon and Netflix for a recent year as follows: a. Compute the fixed asset turnover ratio for each company. Round to one decimal place. b. Which company is more efficient in generating sales from fixed assets? c. Interpret your results.arrow_forwardAmazon.com, Inc. (AMZN) is one of the largest Internet retailers in the world. Target Corporation (TGT) is one of the largest value-priced general merchandisers operating in the L'nited States. Target sells through nearly 1,800 brick-and-mortar stores and through the Internet. Amazon and Target compete for customers across a wide variety of products, including media, general merchandise, apparel, and consumer electronics. Cost of goods sold and inventory information from a recent annual report are provided for both companies as follows (in millions): a. Compute the inventory turnover far both companies. Round all calculations to one decimal place.b. Compute the number of days' sales in inventory for both companies. Use 365 days and round all calculations to one decimal place.c. - Which company has the better inventory efficiency?d. What might explain the difference in inventory efficiency between the two companies?arrow_forward
- Joe’s Jewellery has 45 stores in major malls acround the country. They are considering starting an online business which will require a substantial investment in technology. What are benefits they could not quantify using NPV?arrow_forwardHasbro is a leading firm in the toy, game, and amusement industry. Its promoted brands group includes products from Playskool, Tonka, Milton Bradley, Parker Brothers, Tiger, and Wizards of the Coast. Sales of toys and games are highly variable from year to year depending on whether the latest products meet consumer interests. Hasbro also faces increasing competition from electronic and online games. Hasbro develops and promotes its core brands and manufactures and distributes products created by others under license arrangements. Hasbro pays a royalty to the creator of such products. In recent years, Hasbro has attempted to reduce its reliance on license arrangements, placing more emphasis on its core brands. Hasbro also has embarked on a strategy of reducing fixed selling and administrative costs in an effort to offset the negative effects on earnings of highly variable sales. Exhibit 4.30 presents the balance sheets for Hasbro for the years ended December 31, Years 1 through 4. Exhibit 4.31 presents the income statements and Exhibit 4.32 presents the statements of cash flows for Years 2 through 4. Exhibit 4.30 Exhibit 4.31 Exhibit 4.32 REQUIRED a. Exhibit 4.33 presents profitability ratios for Hasbro for Year 2 and Year 3. Calculate each of these financial ratios for Year 4. The income tax rate is 35%. b. Analyze the changes in ROA and its components for Hasbro over the three-year period, suggesting reasons for the changes observed. c. Analyze the changes in ROCE and its components for Hasbro over the three-year period, suggesting reasons for the changes observed. Exhibit 4.33arrow_forwardBenetton supply chain: One of the best known examples of how an organization can use its supply chain to achieve a competitive advantage is the Benetton Group. Founded by the Benetton family in the 1960s, the company is now one of the largest garment retailers, with stores which bear its name located in almost all parts of the world. Part of the reason for its success has been the way it has organized both the supply side and the demand side of its supply chain. Although Benetton does manufacture much of its production itself, on its supply side the company relies heavily on ‘contractors’. Contractors are companies (many of which are owned, or part-owned, by Benetton employees) that provide services to the Benetton factories by knitting and assembling Benetton’s garments. These contractors, in turn, use the services of sub-contractors to perform some of the manufacturing tasks. Benetton’s manufacturing operations gain two advantages from this. First, its production costs for woollen…arrow_forward
- Pfizer Inc. (PFE) discovers, produces, and distributes medicines, including Celebrex and Lipi-tor. Ford Motor Co. (F) develops, markets, and produces automobiles and trucks. Microsoft Corporation (MSFT) develops, produces, and distributes a variety of computer software and hardware products including Windows, Office, Excel, and the Xbox. 1. Without computing the return on assets, rank from highest to lowest Pfizer, Ford, and Microsoft in terms of their return on assets. 2. The following data (in millions) were taken from recent financial statements of each company: Pfizer Ford Net income ................................. Total assets at the beginning of the year...... Total assets at the end of the year ............ $ 21,979 154,229 181,476 $ 17,937 257,035 267,261 Microsoft $ 61,271 301,311 333,779 Compute the return on assets for each company using the preceding data, and rank the companies’ return on assets from highest to lowest. Round the return on assets to one decimal place. 3.…arrow_forwardThe Camera Shop sells two popular models of digital SLR cameras (Camera A Price: 230, Camera B Price: 310). The sales of these products are not independent of each other, but rather if the price of one increase, the sales of the other will increase. In economics, these two camera models are called substitutable products. The store wishes to establish a pricing policy to maximize revenue from these products. A study of price and sales data shows the following relationships between the quantity sold (N) and prices (P) of each model: NA = 192 - 0.5PA + 0.25PB NB = 305 + 0.08PA - 0.6PB Construct a model for the total revenue and implement it on a spreadsheet. Develop a two-way data table to estimate the optimal prices for each product in order to maximize the total revenue. Vary each price from $250 to $500 in increments of $10. Max profit occurs at Camera A price of $ . Max profit occurs at Camera B price of $ .arrow_forwardTemax realtor company advertises for its business through television, radio, and online. Audience estimates, costs, and maximum media usage limitations are as shown: Constraint Television Radio Online Audience per advertisement 100000 18000 40000 Cost per advertisement 1800 300 600 Maximum media usage 12 18 12 To ensure a balanced use of advertising media, radio advertisements must not exceed 50% of the total number of advertisements authorized. In addition, television should account for at least 10% of the total number of advertisements authorized. 1. If the promotional budget is limited to $17600, how many commercial messages should be run on each medium to maximize total audience contact? What is the allocation of the budget among the three media, and what is the total audience reached? 2. By how much would audience contact increase if an extra $100 were allocated to the promotional budgetarrow_forward
- ROI and RI. (D. Kleespie, adapted) The Sports Equipment Company produces a wide variety of sports equipment. Its newest division, Golf Technology, manufactures and sells a single product— AccuDriver, a golf club that uses global positioning satellite technology to improve the accuracy of golfers’ shots. The demand for AccuDriver is relatively insensitive to price changes. The following data are available for Golf Technology, which is an investment center for Sports Equipment:arrow_forwardCost drivers and value chain. Torrance Technology Company (TTC) is developing a new touchscreen smartphone to compete in the cellular phone industry. The company will sell the phones at wholesale prices to cell phone companies, which will in turn sell them in retail stores to the final customer. TTC has undertaken the following activities in its value chain to bring its product to market:A. Perform market research on competing brands Design a prototype of the TTC smartphone Market the new design to cell phone companies Manufacture the TTC smartphone Process orders from cell phone companies Deliver the TTC smartphones to the cell phone companies Provide online assistance to cell phone users for use of the TTC smartphone Make design changes to the smartphone based on customer feedback During the process of product development, production, marketing, distribution, and customer service, TTC has kept track of the following cost drivers: Number of smartphones shipped by TTC Number of…arrow_forwardProfit margins and turnover ratios vary from one industry to another. Whatdifferences would you expect to find between a grocery chain and a steelcompany? Think particularly about the turnover ratios, the profit margin,and the DuPont equationarrow_forward
arrow_back_ios
SEE MORE QUESTIONS
arrow_forward_ios
Recommended textbooks for you
- Financial And Managerial AccountingAccountingISBN:9781337902663Author:WARREN, Carl S.Publisher:Cengage Learning,
 Financial AccountingAccountingISBN:9781337272124Author:Carl Warren, James M. Reeve, Jonathan DuchacPublisher:Cengage Learning
 Managerial AccountingAccountingISBN:9781337912020Author:Carl Warren, Ph.d. Cma William B. TaylerPublisher:South-Western College Pub
  Financial AccountingAccountingISBN:9781305088436Author:Carl Warren, Jim Reeve, Jonathan DuchacPublisher:Cengage Learning
 Financial Reporting, Financial Statement Analysis...FinanceISBN:9781285190907Author:James M. Wahlen, Stephen P. Baginski, Mark BradshawPublisher:Cengage Learning
 Managerial Accounting: The Cornerstone of Busines...AccountingISBN:9781337115773Author:Maryanne M. Mowen, Don R. Hansen, Dan L. HeitgerPublisher:Cengage Learning
Financial And Managerial Accounting
Accounting
ISBN:9781337902663
Author:WARREN, Carl S.
Publisher:Cengage Learning,
Financial Accounting
Accounting
ISBN:9781337272124
Author:Carl Warren, James M. Reeve, Jonathan Duchac
Publisher:Cengage Learning
Managerial Accounting
Accounting
ISBN:9781337912020
Author:Carl Warren, Ph.d. Cma William B. Tayler
Publisher:South-Western College Pub
Financial Accounting
Accounting
ISBN:9781305088436
Author:Carl Warren, Jim Reeve, Jonathan Duchac
Publisher:Cengage Learning
Financial Reporting, Financial Statement Analysis...
Finance
ISBN:9781285190907
Author:James M. Wahlen, Stephen P. Baginski, Mark Bradshaw
Publisher:Cengage Learning
Managerial Accounting: The Cornerstone of Busines...
Accounting
ISBN:9781337115773
Author:Maryanne M. Mowen, Don R. Hansen, Dan L. Heitger
Publisher:Cengage Learning
How To Analyze an Income Statement; Author: Daniel Pronk;https://www.youtube.com/watch?v=uVHGgSXtQmE;License: Standard Youtube License