
Videos
The article “Gypsum Effect on the Aggregate Size and Geometry of Three Sodic Soils Under Reclamation” (I. Lebron, D. Suarez, and T. Yoshida, Journal of the Soil Science Society of America, 2002:92–98) reports on an experiment in which gypsum was added in various amounts to soil samples before leaching. One of the outcomes of interest was the pH of the soil. Gypsum was added in four different amounts. Three soil samples received each amount added. The pH measurements of the samples are presented in the following table.
| Gypsum (g/kg) | pH | ||
| 0.00 | 7.88 | 7.72 | 7.68 |
| 0.11 | 7.81 | 7.64 | 7.85 |
| 0.19 | 7.84 | 7.63 | 7.87 |
| 0.38 | 7.80 | 7.73 | 8.00 |
Can you conclude that the pH differs with the amount of gypsum added? Provide the value of the test statistic and the P-value.
Check whether the mean pH level differs for the different amounts of gypsum added.
Find the value of test statistic and P-value.
Answer to Problem 1SE
The test statistic is 0.29 and the P-value is 0.832.
There is no sufficient evidence to conclude that the mean pH level differs for the different amounts of gypsum added.
Explanation of Solution
Given info:
The design variable is the Gypsum and the response is the pH measurement. The table provides the pH measurement corresponding to Gypsum.
Calculation:
State the hypotheses:
Null hypothesis:
Alternative hypothesis:
The ANOVA table can be obtained as follows:
Software procedure:
Step by step procedure to obtain One-Way ANOVA using the MINITAB software:
- Choose Stat > ANOVA > One-Way.
- In Response, enter the column of pH.
- In Factor, enter the column of Gypsum.
- In Confidence level, enter 0.95.
- Click OK.
Output using the MINITAB software is given below:
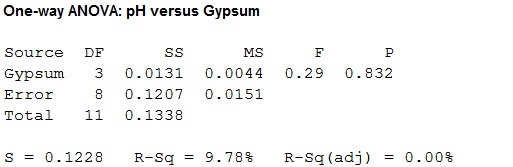
From the ANOVA table, the P-value is 0.832 and the F-value is 0.29.
Decision:
If
If
Since, the level of significance is not specified; the prior level of significance
Conclusion:
Here, the P-value is greater than the level of significance.
That is,
By rejection rule, fails to reject the null hypothesis.
There is sufficient evidence to conclude that the mean pH level differs for the different amounts of gypsum added at
Want to see more full solutions like this?
Chapter 9 Solutions
Statistics for Engineers and Scientists
Additional Math Textbook Solutions
Statistics for Business and Economics (13th Edition)
Statistical Techniques in Business and Economics
Statistics: Informed Decisions Using Data (5th Edition)
Probability and Statistics for Engineering and the Sciences
Elementary Statistics ( 3rd International Edition ) Isbn:9781260092561
EBK STATISTICAL TECHNIQUES IN BUSINESS


- The authors of the article “Predictive Model for PittingCorrosion in Buried Oil and Gas Pipelines”(Corrosion, 2009: 332–342) provided the data on whichtheir investigation was based.a. Consider the following sample of 61 observations onmaximum pitting depth (mm) of pipeline specimensburied in clay loam soil. 0.41 0.41 0.41 0.41 0.43 0.43 0.43 0.48 0.480.58 0.79 0.79 0.81 0.81 0.81 0.91 0.94 0.941.02 1.04 1.04 1.17 1.17 1.17 1.17 1.17 1.171.17 1.19 1.19 1.27 1.40 1.40 1.59 1.59 1.601.68 1.91 1.96 1.96 1.96 2.10 2.21 2.31 2.462.49 2.57 2.74 3.10 3.18 3.30 3.58 3.58 4.154.75 5.33 7.65 7.70 8.13 10.41 13.44Construct a stem-and-leaf display in which the twolargest values are shown in a last row labeled HI.b. Refer back to (a), and create a histogram based oneight classes with 0 as the lower limit of the firstclass and class widths of .5, .5, .5, .5, 1, 2, 5, and 5,respectively.c. The accompanying comparative boxplot fromMinitab shows plots of pitting depth for four differenttypes of soils.…arrow_forwardThe article “Differences in Susceptibilities of Different Cell Lines to Bilirubin Damage” (K. Ngai, C. Yeung, and C. Leung, Journal of Paediatric Child Health, 2000:36–45) reports an investigation into the toxicity of bilirubin on several cell lines. Ten sets of human liver cells and 10 sets of mouse fibroblast cells were placed into solutions of bilirubin in albumin with a 1.4 bilirubin/albumin molar ratio for 24 hours. In the 10 sets of human liver cells, the average percentage of cells surviving was 53.9 with a standard deviation of 10.7. In the 10 sets of mouse fibroblast cells, the average percentage of cells surviving was 73.1 with a standard deviation of 9.1. Find a 98% confidence interval for the difference in survival percentages between the two cell lines.arrow_forwardAn article in Knee Surgery, Sports Traumatology, Arthroscopy (2005, Vol. 13, pp. 273-279) considered arthroscopic meniscal repair with an absorbable screw. Results showed that for tears greater than 25 millimeters, 14 of 18 (78%) repairs were successful, but for shorter tears, 22 of 30 (73%) repairs were successful. A doctor would like to know if there is evidence that the success rate is greater for longer tears. The P-value for the test H0: p1 = p2 versus H1: p1 > p2 is closest to:arrow_forward
- classify as either observational or experimental design Heart Failure. In the paper “Cardiac-Resynchronization Therapy with or without an Implantable Defibrillator in Advanced Chronic Heart Failure” (New England Journal of Medicine, Vol. 350, pp. 2140–2150), M. Bristow et al. reported the results of a study of methods for treating patients who had advanced heart failure due to ischemic or nonischemic cardiomyopathies. A total of 1520 patientswere randomly assigned in a 1:2:2 ratio to receive optimal pharmacologic therapy alone or in combination with either a pacemaker or a pacemaker–defibrillator combination. The patients were thenobserved until they died or were hospitalized for any cause.arrow_forwardA paper investigated the driving behavior of teenagers by observing their vehicles as they left a high school parking lot and then again at a site approximately 1 2 mile from the school. Assume that it is reasonable to regard the teen drivers in this study as representative of the population of teen drivers. MaleDriver FemaleDriver 1.4 -0.2 1.2 0.5 0.9 1.1 2.1 0.7 0.7 1.1 1.3 1.2 3 0.1 1.3 0.9 0.6 0.5 2.1 0.5 (a) Use a .01 level of significance for any hypothesis tests. Data consistent with summary quantities appearing in the paper are given in the table. The measurements represent the difference between the observed vehicle speed and the posted speed limit (in miles per hour) for a sample of male teenage drivers and a sample of female teenage drivers. (Use ?males − ?females. Round your test statistic to two decimal places. Round your degrees of freedom down to the nearest whole number. Round your p-value to three decimal places.) t = df =…arrow_forwardAn article in Knee Surgery, Sports Traumatology, Arthroscopy, "Arthroscopic meniscal repair with an absorbable screw: results and surgical technique," (2005, Vol. 13, pp. 273-279) cites a success rate of 1% for meniscal tears with a rim width of less than 3 mm, and a 1% success rate for tears from 3-6 mm. If you are unlucky enough to suffer a meniscal tear of less than 3 mm on your left knee, and one of width 3-6 mm on your right knee, what is the probability that you have exactly one successful surgery? assume surgieries are independent.arrow_forward
- A paper investigated the driving behavior of teenagers by observing their vehicles as they left a high school parking lot and then again at a site approximately 1 2 mile from the school. Assume that it is reasonable to regard the teen drivers in this study as representative of the population of teen drivers. MaleDriver FemaleDriver 1.3 -0.3 1.3 0.6 0.9 1.1 2.1 0.7 0.7 1.1 1.3 1.2 3 0.1 1.3 0.9 0.6 0.5 2.1 0.5 (a) Use a .01 level of significance for any hypothesis tests. Data consistent with summary quantities appearing in the paper are given in the table. The measurements represent the difference between the observed vehicle speed and the posted speed limit (in miles per hour) for a sample of male teenage drivers and a sample of female teenage drivers. (Use ?males − ?females. Round your test statistic to two decimal places. Round your degrees of freedom down to the nearest whole number. Round your p-value to three decimal places.) t = df =…arrow_forward1. In the book Design and Analysis of Experiments, 8th edition (2012, John Wiley & Sons), the results of an experiment involving a storage battery used in the launching mechanism of a shoulder-fired ground-to-air missile were presented. Three material types can be used to make the battery plates. The objective is to design a battery that is relatively unaffected by the ambient temperature. The output response from the battery is effective life in hours. Three temperature levels are selected, and a factorial experiment with four replicates is run. The data are as follows: Table 11.(a) Test the appropriate hypotheses and draw conclusions using the analysis ether either firing temperature or furnace position affects the baked density of a carbon anode. The data are as follows: Table 12.(a) State the hypotheses of interest. (b) Test the hypotheses in part (a) using the analysis of variance with a = 0.05. What are your conclusions? (c) Analyze the residuals from this experiment. (d)…arrow_forward3.36 An article in the Journal of the Electrochemical Society (Vol. 139, No. 2, 1992, pp. 524–532) describes an experiment to investigate the low-pressure vapor deposition of polysilicon. The experiment was carried out in a large-capacity reactor at Sematech in Austin, Texas. The reactor has several wafer positions, and four of these positions are selected at random. The response variable is film thickness uniformity. Three replicates of the experiment were run, and the data are as follows: Wafer Position Uniformity 1 2.76 5.67 4.49 2 1.43 1.70 2.19 3 2.34 1.97 1.47 4 0.94 1.36 1.65 (a) Is there a difference in the wafer positions? Use ???? = 0.05. (b) Estimate the variability due to wafer positions. (c) Estimate the random error component. (d) Analyze the residuals from this experiment and comment on model adequacy.arrow_forward
- 3.36 An article in the Journal of the Electrochemical Society (Vol. 139, No. 2, 1992, pp. 524–532) describes an experiment to investigate the low-pressure vapor deposition of polysilicon. The experiment was carried out in a large-capacity reactor at Sematech in Austin, Texas. The reactor has several wafer positions, and four of these positions are selected at random. The response variable is film thickness uniformity. Three replicates of the experiment were run, and the data are as follows: Wafer Position Uniformity 1 2.76 5.67 4.49 2 1.43 1.70 2.19 3 2.34 1.97 1.47 4 0.94 1.36 1.65 (a) Is there a difference in the wafer positions? Use ???? = 0.05. (b) Estimate the variability due to wafer positions. (c) Estimate the random error component. (d) Analyze the residuals from this experiment and comment on model adequacy. could you please do parts c and darrow_forwardSuppose a researcher is interested inthe effectiveness in a new childhood exercise program implemented in a SRS of schools across a particular county. In order to test the hypothesis that the new program decreases BMI (Kg/m2), the researcher takes a SRS of children from schools where the program is employed and a SRS from schools that do not employ the program and compares the results. Assume the following table represents the SRSs of students and their BMIs. Student intervention group BMI (kg/m2) Student control group BMI (kg/m2) A 18.6 A 21.6 B 18.2 B 18.9 C 19.5 C 19.4 D 18.9 D 22.6 E 24.1 F 23.6 A) Assuming that all the necessary conditions are met (normality, independence, etc.) carry out the appropriate statistical test to determine if the new exercise program is effective. Use an alpha level of 0.05. Do not assume equal variances.B) Construct a 95% confidence interval about your estimate for the average difference in BMI between the groups.arrow_forwardLow-Birth-Weight Hospital Stays. Data on low-birthweight babies were collected over a 2-year period by 14 participating centers of the National Institute of Child Health and Human Development Neonatal Research Network. Results were reported by J. Lemons et al. in the on-line paper “Very Low Birth Weight Outcomes of the National Institute of ChildHealth and Human Development Neonatal Research Network” (Pediatrics, Vol. 107, No. 1, p. e1). For the 1084 surviving babies whose birth weights were 751– 1000 grams, the average length of stay in the hospital was 86 days, although one center had an average of 66 days and another had an average of 108 days. a. Can the mean lengths of stay be considered population means? Explain your answer.b. Assuming that the population standard deviation is 12 days, determine the z-score for a baby’s length of stay of 86 days at the center where the mean was 66 days.c. Assuming that the population standard deviation is 12 days, determine the z-score for a…arrow_forward
 MATLAB: An Introduction with ApplicationsStatisticsISBN:9781119256830Author:Amos GilatPublisher:John Wiley & Sons Inc
 Probability and Statistics for Engineering and th...StatisticsISBN:9781305251809Author:Jay L. DevorePublisher:Cengage Learning
 Statistics for The Behavioral Sciences (MindTap C...StatisticsISBN:9781305504912Author:Frederick J Gravetter, Larry B. WallnauPublisher:Cengage Learning
 Elementary Statistics: Picturing the World (7th E...StatisticsISBN:9780134683416Author:Ron Larson, Betsy FarberPublisher:PEARSON
 The Basic Practice of StatisticsStatisticsISBN:9781319042578Author:David S. Moore, William I. Notz, Michael A. FlignerPublisher:W. H. Freeman
 Introduction to the Practice of StatisticsStatisticsISBN:9781319013387Author:David S. Moore, George P. McCabe, Bruce A. CraigPublisher:W. H. Freeman