
Concept explainers
Videos
A production line operates with a mean filling weight of 16 ounces per container. Overfilling or underfilling presents a serious problem and when detected requires the operator to shut down the production line to readjust the filling mechanism. From past data, a population standard deviation σ = .8 ounces is assumed. A quality control inspector selects a sample of 30 items every hour and at that time makes the decision of whether to shut down the line for readjustment. The level of significance is α = .05.
- a. State the hypothesis test for this quality control application.
- b. If a sample mean of
- c. If a sample mean of
- d. Use the critical value approach. What is the rejection rule for the preceding hypothesis testing procedure? Repeat parts (b) and (c). Do you reach the same conclusion?
a.
Identify the null and alternative hypotheses for the given situation.
Answer to Problem 60SE
The null and alternative hypotheses are given below:
Null hypothesis:
Alternative hypothesis:
Explanation of Solution
The given information is that the mean filling weight is 16 ounces.
Here, the claim is that overfilling or underfilling exists. This can be written as
The null and alternative hypotheses are given below:
Null hypothesis:
Alternative hypothesis:
b.
Find the p-value when
Answer to Problem 60SE
The p-value is 0.028.
The conclusion is that there is evidence that the overfilling or underfilling exists.
Explanation of Solution
Calculation:
The given information is that
Test statistic and p-value:
Software Procedure:
A step-by-step procedure to obtain the test statistic using MINITAB software:
- Choose Stat > Basic Statistics > 1-Sample Z.
- In Summarized data, enter the sample size as 30 and mean as 16.32.
- In Standard deviation, enter a value for s as 0.8.
- In Perform hypothesis test, enter the test mean as 16.
- Check Options; enter Confidence level as 95%.
- Choose not equal in alternative.
- Click OK.
Output using MINITAB software is given below:
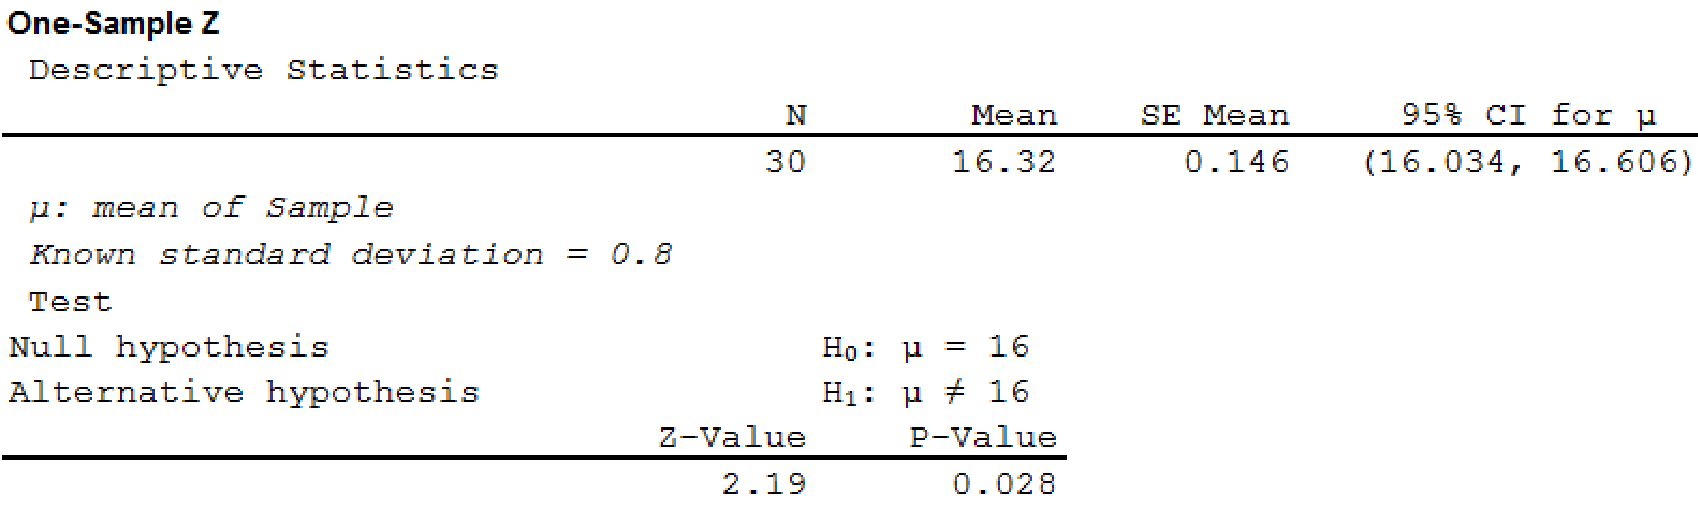
From the output, the test statistic is 2.19, and the p-value is 0.028.
Rejection rule:
If
If
Conclusion:
Here, the p-value is less than the level of significance.
That is,
By the rejection rule, the null hypothesis is rejected.
Hence, there is evidence that the overfilling or underfilling exists. That is, the production line operates properly. Thus, the actions shut down and readjust the production line would be recommended.
c.
Find the p-value when
Answer to Problem 60SE
The p-value is 0.218.
The conclusion is that there is no evidence that the overfilling or underfilling exists.
Explanation of Solution
Calculation:
The given information is that
Test statistic and p-value:
Software Procedure:
A step-by-step procedure to obtain the test statistic using MINITAB software:
- Choose Stat > Basic Statistics > 1-Sample Z.
- In Summarized data, enter the sample size as 30 and mean as 15.82.
- In Standard deviation, enter a value for s as 0.8.
- In Perform hypothesis test, enter the test mean as 16.
- Check Options; enter Confidence level as 95%.
- Choose not equal in alternative.
- Click OK.
Output using MINITAB software is given below:
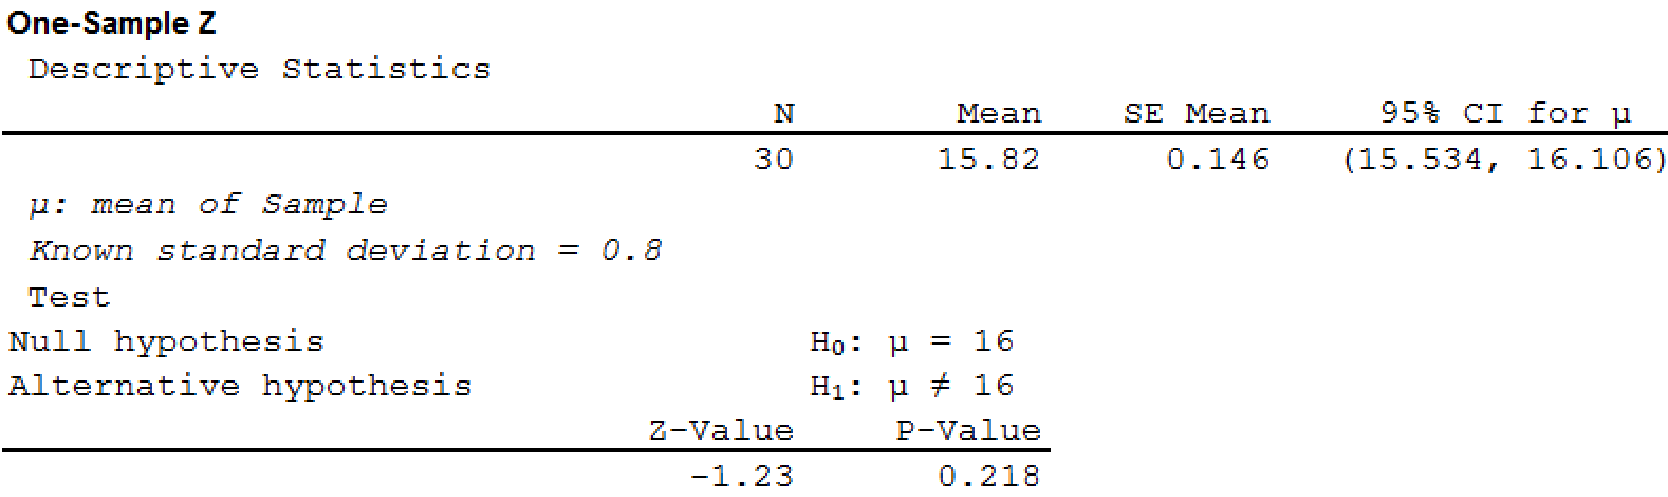
From the output, the test statistic is –1.23, and the p-value is 0.218.
Conclusion:
Here, the p-value is greater than the level of significance.
That is,
By the rejection rule, the null hypothesis is not rejected.
Hence, there is no evidence that the overfilling or underfilling exists. That is, the production line does not operate properly. Thus, the action to continue the production process would be recommended.
d.
Find the rejection rule using the critical value approach.
Find the conclusion when
Answer to Problem 60SE
The rejection rule using the critical value is as follows:
If
The conclusion for
The conclusion for
Explanation of Solution
Calculation:
The rejection rule for a two-tailed test using the critical value is as follows:
If
Critical value:
Software Procedure:
A step-by-step procedure to obtain the critical value using MINITAB software:
- Choose Graph > Probability Distribution Plot choose View Probability> OK.
- From Distribution, choose ‘Normal’ distribution.
- Click the Shaded Area tab.
- Choose Probability Value and Both Tails for the region of the curve to shade.
- Enter the Probability value as 0.05.
- Click OK.
Output using MINITAB software is given below:
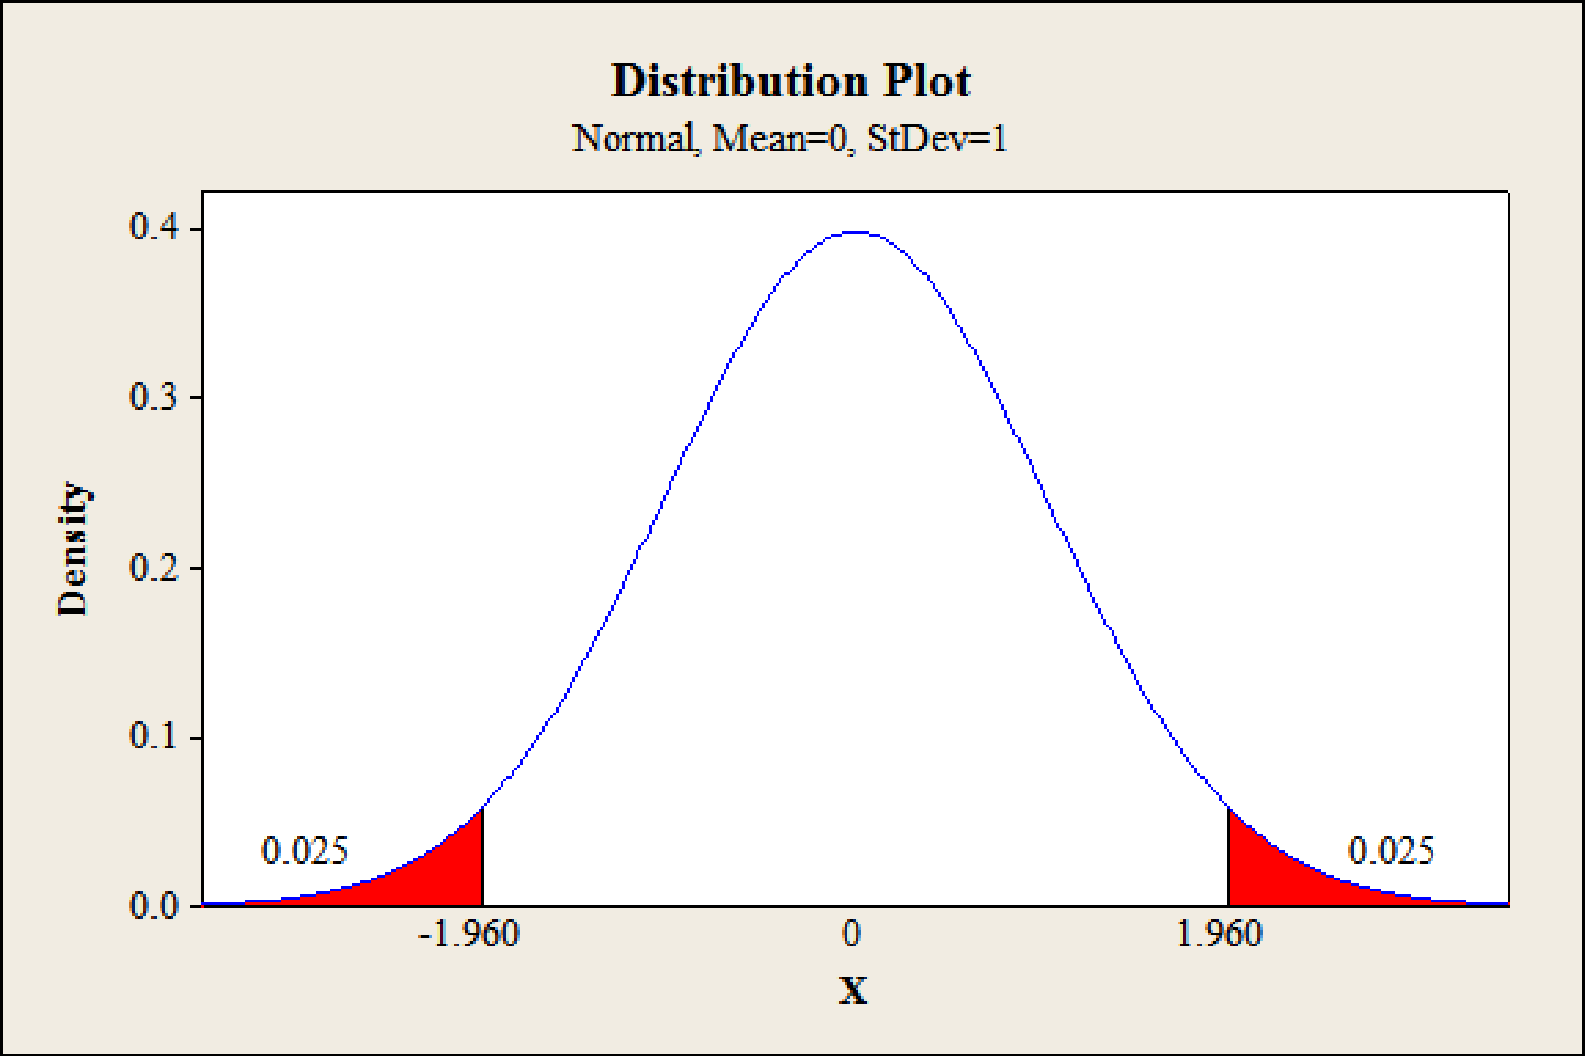
From the output, the critical value is
Rejection rule:
If
Conclusion for
Here, the test statistic is greater than the critical value.
That is,
By the rejection rule, the null hypothesis is rejected.
Hence, there is evidence that the overfilling or underfilling exists. That is, the production line operates properly. Thus, the actions shut down and readjust the production line would be recommended.
Conclusion for
Here, the test statistic is greater than the critical value.
That is,
By the rejection rule, the null hypothesis is not rejected.
Hence, there is no evidence that the overfilling or underfilling exists. That is, the production line does not operate properly. Thus, the action to continue the production process would be recommended.
Want to see more full solutions like this?
Chapter 9 Solutions
STATISTICS F/BUSINESS+ECONOMICS-TEXT


 MATLAB: An Introduction with ApplicationsStatisticsISBN:9781119256830Author:Amos GilatPublisher:John Wiley & Sons Inc
 Probability and Statistics for Engineering and th...StatisticsISBN:9781305251809Author:Jay L. DevorePublisher:Cengage Learning
 Statistics for The Behavioral Sciences (MindTap C...StatisticsISBN:9781305504912Author:Frederick J Gravetter, Larry B. WallnauPublisher:Cengage Learning
 Elementary Statistics: Picturing the World (7th E...StatisticsISBN:9780134683416Author:Ron Larson, Betsy FarberPublisher:PEARSON
 The Basic Practice of StatisticsStatisticsISBN:9781319042578Author:David S. Moore, William I. Notz, Michael A. FlignerPublisher:W. H. Freeman
 Introduction to the Practice of StatisticsStatisticsISBN:9781319013387Author:David S. Moore, George P. McCabe, Bruce A. CraigPublisher:W. H. Freeman