Introduction To Statistics And Data Analysis
6th Edition
ISBN: 9781337793612
Author: PECK, Roxy.
Publisher: Cengage Learning,
bartleby

Concept explainers

bartleby

Videos

Textbook Question
Book Icon
Chapter 9, Problem 72CR

The article “Write It by Hand to Make It Stick” (Advertising Age, July 27, 2016) summarizes data from a survey of 1001 students age 13 to 19. Of the students surveyed, 851 reported that they learn best using a mix of digital and nondigital tools. Construct and interpret a 95% confidence interval for the proportion of students age 13 to 19 who would say that they learn best using a mix of digital and non-digital tools. For the method used to construct the interval to be valid, what assumption about the sample must be reasonable?

Expert Solution & Answer
Check Mark
To determine

Find the 95% confidence interval for the proportion of student’s age 13 to 19 who will say that they learn best using a mix of digital and non-digital tools and interpret it. Also, explain the assumption required for the confidence interval to be valid.

Answer to Problem 72CR

The 95% confidence interval for the proportion of student’s age 13 to 19 who will say that they learn best using a mix of digital and non-digital tools is (0.828,0.872).

Interpretation of confidence interval is “One can be 95% confident that the proportion of student’s age 13 to 19 who will say that they learn best using a mix of digital and non-digital tools is between 0.828 and 0.872”.

Explanation of Solution

Calculation:

It was found that 851 of the 1,001 students surveyed reported that they learn best using a mix of digital and non-digital tools.

The confidence interval for a population proportion p is appropriate in given cases:

  • The sample size is large. That is, when np^10 and n(1p^)10,
  • The sample size is small relative to the population size. That is, the sample size should not be more than 10% of the population size.
  • The sampling method is simple random sampling.

Then, the general formula for finding the confidence interval for a population proportion p is, p^±(z critical value)p^(1p^)n , where p^ is the sample proportion, and n is the sample size.

The number of student’s age 13 to 19 who will say that they learn best using a mix of digital and non-digital tools is 851 of the 1,001 students surveyed. That is, the sample proportion is, 8511,001 .

Check conditions:

Substitute, n=1,001 and p^=8511,001.

np^=1,001(8511,001)=851>10

n(1p^)=1,001(18511,001)=1,001(1501,001)=150>10

Since, both the conditions are satisfied and the sample is large, which makes the confidence interval appropriate.

The population is considered for student’s aging 13 to 19 who will say that they learn best using a mix of digital and non-digital tools. A sample of 1,001 students is selected for the survey. Since the population considered is large, the sample size will be smaller than 10% of the population size.

It is assumed that the sample is a representative of the population of student’s age 13 to 19 years. Thus, it is reasonable to consider the sample as a random sample from the population.

The 95% confidence interval for proportion is calculated below:

Software procedure:

Step-by-step procedure to obtain the confidence interval using MINITAB software is given below:

  • Choose Stat > Basic statistics>1-Sample proportion.
  • In Summarized data, enter Number of events as 851 and Number of trials as 1,001.
  • Check Options, enter Confidence level as 95.
  • Choose not equal in alternative hypothesis.
  • In method select Normal Approximation.
  • Click OK in all dialogue boxes.

The output using the MINITAB software is given below:

Introduction To Statistics And Data Analysis, Chapter 9, Problem 72CR

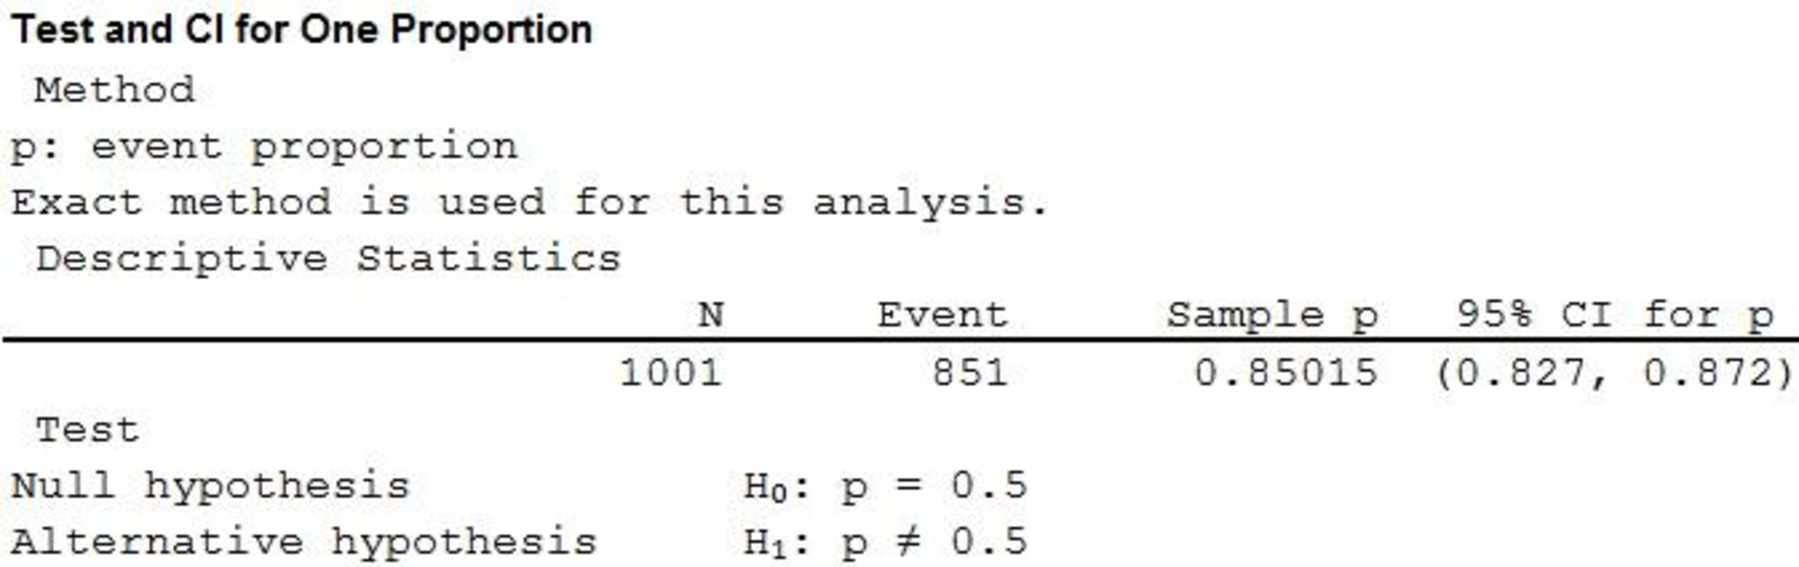
From the MINITAB output, the confidence interval is (0.827, 0.872).

Thus, the 95% confidence interval for the proportion of student’s age 13 to 19 who will say that they learn best using a mix of digital and non-digital tools is (0.828,0.872).

Interpretation of confidence interval is “it is 95% confident that the proportion of student’s age 13 to 19 who will say that they learn best using a mix of digital and non-digital tools is between 0.828 and 0.872”.

The assumption made for the confidence interval to be valid is that the sample was selected randomly and it is a representative of the population of all students age 13 to 19.

Want to see more full solutions like this?

Subscribe now to access step-by-step solutions to millions of textbook problems written by subject matter experts!

Chapter 9 Solutions

Introduction To Statistics And Data Analysis

Ch. 9.2 - Explain which would result in a wider large-sample...Ch. 9.2 - The formula used to calculate a large-sample...Ch. 9.2 - The use of the interval p(zcriticalvalue)p(1p)n...Ch. 9.2 - For each of the following combinations of sample...Ch. 9.2 - Discuss how each of the following factors affects...Ch. 9.2 - The USA TODAY Snapshot titled Social Media...Ch. 9.2 - Based on data from a survey of 1200 randomly...Ch. 9.2 - The report Parents, Teens and Digital Monitoring...Ch. 9.2 - If a hurricane was headed your way, would you...Ch. 9.2 - The USA TODAY Snapshot titled Big Bang Theory (USA...Ch. 9.2 - The article Most Dog Owners Take More Pictures of...Ch. 9.2 - The Princeton Review 2016 College Hopes and...Ch. 9.2 - The USA TODAY Snapshot titled Babys First Photo...Ch. 9.2 - The report Job Seeker Nation Study...Ch. 9.2 - USA TODAY reported that the proportion of...Ch. 9.2 - The USA TODAY Snapshot titled Have a Nice Trip...Ch. 9.2 - Business Insider reported that a study...Ch. 9.2 - In 2010, the National Football League adopted new...Ch. 9.2 - The article Most Americans Dont Understand the...Ch. 9.2 - The Gallup Organization conducts an annual survey...Ch. 9.2 - The article Hospitals Dispute Medtronic Data on...Ch. 9.2 - Based on survey of a representative sample of 1000...Ch. 9.2 - A discussion of digital ethics appears in the...Ch. 9.2 - In spite of the potential safety hazards, some...Ch. 9.2 - In 2010, the online security firm Symantec...Ch. 9.3 - Given a variable that has at distribution with the...Ch. 9.3 - The formula used to calculate a confidence...Ch. 9.3 - USA TODAY reported that the average amount of...Ch. 9.3 - Samples of two different models of cars were...Ch. 9.3 - USA TODAY reported that the average amount of...Ch. 9.3 - The paper The Effects of Adolescent Volunteer...Ch. 9.3 - Medical research has shown that repeated wrist...Ch. 9.3 - Students in a representative sample of 65...Ch. 9.3 - The paper referenced in the previous exercise also...Ch. 9.3 - Suppose that a random sample of 50 bottles of a...Ch. 9.3 - The authors of the paper Driving Performance While...Ch. 9.3 - The article The Association Between Television...Ch. 9.3 - The paper Patterns and Composition of Weight...Ch. 9.3 - Because of safety considerations, in May 2003 the...Ch. 9.3 - Example 9.3 gave the following airborne times (in...Ch. 9.3 - Consumer Reports gave the following mileage...Ch. 9.3 - Five students visiting the student health center...Ch. 9.3 - The Bureau of Alcohol, Tobacco, and Firearms...Ch. 9.3 - The formula described in this section for...Ch. 9.4 - The following quote is from the article Credit...Ch. 9.4 - Authors of the news release titled Major Gaps...Ch. 9.4 - The paper The Curious Promiscuity of Queen Honey...Ch. 9.5 - A survey on SodaHead...Ch. 9.5 - Prob. 59ECh. 9.5 - Prob. 60ECh. 9.5 - Prob. 61ECh. 9.5 - Prob. 62ECh. 9.5 - Prob. 63ECh. 9.5 - Prob. 64ECh. 9.5 - Prob. 65ECh. 9.6 - Prob. 66ECh. 9.6 - Prob. 67ECh. 9.6 - Teams in the National Football League (NFL) are...Ch. 9.6 - Prob. 69ECh. 9.6 - The Economist collects data each year on the price...Ch. 9.6 - Major League Baseball (MLB) includes two groups of...Ch. 9 - The article Write It by Hand to Make It Stick...Ch. 9 - Prob. 73CRCh. 9 - The report The 2016 Consumer Financial Literacy...Ch. 9 - The report The Politics of Climate (Pew Research...Ch. 9 - The report referenced in the previous exercise...Ch. 9 - Data from a survey of a representative sample was...Ch. 9 - A manufacturer of small appliances purchases...Ch. 9 - A manufacturer of college textbooks is interested...Ch. 9 - The confidence intervals presented in this chapter...Ch. 9 - Prob. 81CRCh. 9 - The interval from 2.33 to 1.75 captures an area of...
Knowledge Booster
Background pattern image
Statistics
Learn more about
Need a deep-dive on the concept behind this application? Look no further. Learn more about this topic, statistics and related others by exploring similar questions and additional content below.
Recommended textbooks for you
Text book image
Glencoe Algebra 1, Student Edition, 9780079039897...
Algebra
ISBN:9780079039897
Author:Carter
Publisher:McGraw Hill
Text book image
College Algebra (MindTap Course List)
Algebra
ISBN:9781305652231
Author:R. David Gustafson, Jeff Hughes
Publisher:Cengage Learning
Statistics 4.1 Point Estimators; Author: Dr. Jack L. Jackson II;https://www.youtube.com/watch?v=2MrI0J8XCEE;License: Standard YouTube License, CC-BY
Statistics 101: Point Estimators; Author: Brandon Foltz;https://www.youtube.com/watch?v=4v41z3HwLaM;License: Standard YouTube License, CC-BY
Central limit theorem; Author: 365 Data Science;https://www.youtube.com/watch?v=b5xQmk9veZ4;License: Standard YouTube License, CC-BY
Point Estimate Definition & Example; Author: Prof. Essa;https://www.youtube.com/watch?v=OTVwtvQmSn0;License: Standard Youtube License
Point Estimation; Author: Vamsidhar Ambatipudi;https://www.youtube.com/watch?v=flqhlM2bZWc;License: Standard Youtube License