
a
To plot:
Graphical representation of isoquant and quantity of K and L.
a
Explanation of Solution
Since q = 40,000 has been produced with
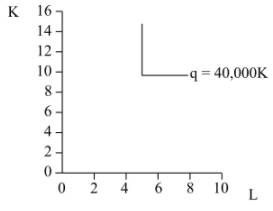
In the above diagram, x-axis measures labor while y-axis measures capital, q represents isoquant of Large Mowers as depicted above.
Introduction:
Isoquant curve is a graphical representation showing the same level of output production with different combinations of inputs.
b)
To plot:
Graphical function of isoquant for small mower.
b)
Explanation of Solution
This diagram shows the plotting of q = 40,000, K = 8 and L = 8
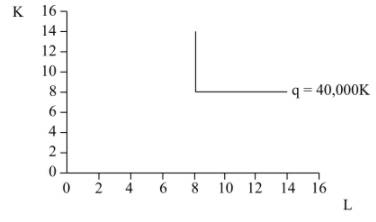
In the above diagram, x-axis measures labor while the y-axis measures capital. Q represents isoquant of Small Mowers as depicted above.
Introduction:
Expansion path is a combination of optimal output when input changes due to prices.
c)
To know:
Quantities of K and L for different lawn divisions.
c)
Explanation of Solution
Production functions are given below:
When lawn is cut by 1st method:
When lawn is cut by 2nd method:
Total capital requirement = 9
Total labor requirement = 6.5
Production functions are given below:
When lawn is cut by 1st method:
When lawn is cut by 2nd method:
Total capital requirement = 9.5
Total labor requirement = 5.75
The fraction of K and L means the amount of capital input used per unit of labor.
This table shows the resources uses in the Large Mowers and Small Mowers.
| 40,000 sq.ft. | LM | SM | ||
| LM/SM mix | L | K | L | K |
| 0/100$% | 0 | 0 | 8 | 8 |
| 25%/75% | 1.25 | 2.5 | 6 | 6 |
| 50%/50% | 2.5 | 5 | 4 | 4 |
| 75%/25% | 3.75 | 7.5 | 2 | 2 |
| 100%/0% | 5 | 10 | 0 | 0 |
Introduction:
Isoquant curve is a graphical representation showing the same level of output production with different combinations of inputs.
d)
To plot:
Graphical representation of isoquant.
d)
Explanation of Solution
Calculation of labor and capital when 40000 square foot of lawn is cut by 1st method with p fraction.
Calculation of labor and capital when (1-p) fraction of 40,000 square foot lawn is cut by 2nd method.
Calculation of labor requirement:
Calculation of total capital requirement:
Two equations are given as follows:
Solving first equation for p and putting the value of p in second as shown below:
The Table shows the different calculations of Labor (L) and capital (K) in Small Mowers as shown below:
| 40,000 sq.ft. | LM | |
| LM/SM mix | L | K |
| 0/100$% | 8 | 8 |
| 25%/75% | 7.25 | 8.5 |
| 50%/50% | 6.5 | 9 |
| 75%/25% | 5.75 | 9.5 |
| 100%/0% | 5 | 10 |
Following graph is plotted from the given table shows the isoquant for the combined production function as shown below:
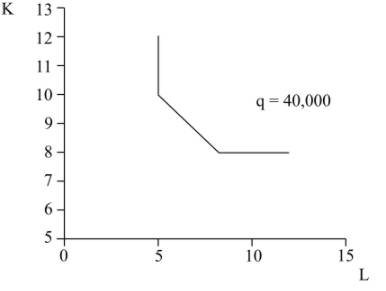
In the above diagram, x-axis measures labor while y-axis measures capital, q represents isoquant for the combined production function as depicted above.
Introduction:
Expansion path is a combination of optimal output when input changes due to prices.
Want to see more full solutions like this?
Chapter 9 Solutions
Microeconomic Theory

- What is the difference between a fixed input and a variable input?arrow_forwardWhat shapes would you generally expect a total product curve and a marginal product curve to have?arrow_forwardIf two painters can paint 200 square feet of wall in an hour, and three painters can paint 275 square feet, what is the marginal product of the third painter?arrow_forward

 Exploring EconomicsEconomicsISBN:9781544336329Author:Robert L. SextonPublisher:SAGE Publications, Inc
 Economics: Private and Public Choice (MindTap Cou...EconomicsISBN:9781305506725Author:James D. Gwartney, Richard L. Stroup, Russell S. Sobel, David A. MacphersonPublisher:Cengage Learning
 Microeconomics: Private and Public Choice (MindTa...EconomicsISBN:9781305506893Author:James D. Gwartney, Richard L. Stroup, Russell S. Sobel, David A. MacphersonPublisher:Cengage Learning