
Videos
Refer to Exercise 13 in Section 9.1.
- a. Use the Bonferroni method to determine which pairs of means, if any, are different at the 5% level.
- b. Use the Tukey-Kramer method to determine which pairs of means, if any, are different at the 5% level.
- c. Which is the more powerful method to find all the pairs of treatments whose means are different, the Bonferroni method or the Tukey–Kramer method?
a.
Compare the pairs of treatments and conclude that any of the mean temperatures are different at 5% level of significance level of significance using Bonferroni method.
Answer to Problem 5E
The conclusion is that the mean temperature of
The mean temperature of
Explanation of Solution
Calculation:
The given information is based on conducting experiment on tensile strength of iron. A sample of 5 specimens with four temperatures has been taken to test its tensile strength.
The aim is to compare the means of temperatures.
Bonferroni method for the comparison of multiple means:
Comparison of two means:
The mean effects of the ith and jth groups are considered to be significantly different, if the following condition is satisfied:
Where,
Where, N is the sample size, C be the number of pairs of difference to compare such that
The value of C is:
Substitute
The number of pairs to compare is 6.
The critical value at 5% level of significance is:
Substitute
Software procedure:
Step by step procedure to obtain the critical-value using the MINITAB software is given below:
- Choose Graph > Probability Distribution Plot choose View Probability> OK.
- From Distribution, choose ‘t’ distribution.
- Enter Degrees of freedom as 16.
- Click the Shaded Area tab.
- Choose P Value and Right Tail for the region of the curve to shade.
- Enter the data value as 0.004167.
- Click OK.
Output using the MINITAB software is given below:
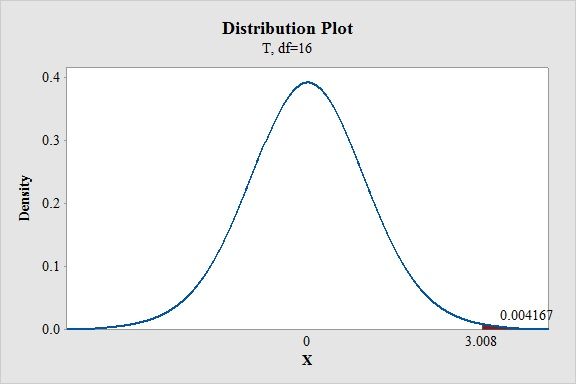
From the MINITAB output, the value of
From the Exercise 13 in section 9.1, the value of MSE is 2.30.
The value of
Substitute the
Descriptive measures of temperatures:
Software procedure:
Step by step procedure to obtain the descriptive measures using the MINITAB software is given below:
- Choose Stat > Basic Statistics > Display Descriptive Statistics.
- In Variables enter the columns
- Choose option statistics, and select N total and Mean.
- Click OK.
Output obtained using MINITAB is given below:
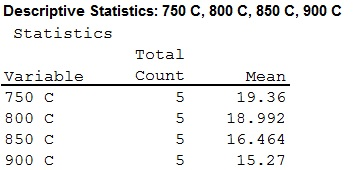
From the MINITAB, the mean value of
Compare the means of
State the hypotheses:
Null hypothesis:
That is, there is no significant difference between the mean effects of ith and jth treatments.
Alternative hypothesis:
That is, there is significant difference between the mean effects of ith and jth treatments.
Substitute
It has been found that the difference of mean
Thus, the means of the
Compare the means of
Substitute
It has been found that the difference of mean
Thus, the means of the
Compare the means of
Substitute
It has been found that the difference of mean
Thus, the means of the
Compare the means of
Substitute
It has been found that the difference of mean
Thus, the mean of the
Compare the means of
Substitute
It has been found that the difference of mean
Thus, the means of the
Compare the means of
Substitute
It has been found that the difference of mean
Thus, the means of the
Thus, by comparing the mean temperature of
Hence it is clear that the mean temperature of
b.
Compare the pairs of treatments and conclude that any of the mean temperatures are different at 5% level of significance level of significance using Tukey-Kramer method.
Answer to Problem 5E
The conclusion is that the mean temperature of
The mean temperature of
Explanation of Solution
Calculation:
The aim is to compare the means of temperature.
Tukey-Kramer method for the comparison of multiple means:
Comparison of two means:
The mean effects of the ith and jth groups are considered to be significantly different, if the following condition is satisfied:
Where, N is the sample size, I denotes the number of treatments,
The studentized range value at 5% level of significance is:
Substitute
Use Table A.9: upper percentage points for the studentized range value.
Procedure:
For
- Locate
- Locate
- Obtain the value in the corresponding row below 0.05.
That is,
From the Exercise 13 in section 9.1, the value of MSE is 2.30.
The value of
Substitute the
From the previous part (a), the mean value of
Compare the means of
Substitute
It has been found that the difference of mean
Thus, the means of the
Compare the means of
Substitute
It has been found that the difference of mean
Thus, the means of the
Compare the means of
Substitute
It has been found that the difference of mean
Thus, the means of the
Compare the means of
Substitute
It has been found that the difference of mean
Thus, the means of the
Compare the means of
Substitute
It has been found that the difference of mean
Thus, the means of the
Compare the means of
Substitute
It has been found that the difference of mean
Thus, the means of the
Thus, by comparing the mean temperature of
Hence it is clear that the mean temperature of
c.
Identify the more powerful method among the Bonferroni method and Tukey-Kramer method.
Answer to Problem 5E
The Tukey-Kramer method is more powerful than the Bonferroni method.
Explanation of Solution
Interpretation:
Condition for more powerful method of multiple comparisons:
The method of multiple comparisons, which has a smaller critical value for a given dataset, is the more powerful method of multiple comparisons for that particular dataset.
From the previous parts (a) and (b), the critical value of the Bonferroni method at 5% level of significance is 2.885 and the critical value of the Tukey-Kramer method at 5% level of significance is 2.75.
Therefore, the critical value of Tukey-Kramer method holds the minimum critical value and it is said to be more powerful than the Bonferroni method.
Want to see more full solutions like this?
Chapter 9 Solutions
Statistics for Engineers and Scientists
Additional Math Textbook Solutions
Elementary Statistics Using The Ti-83/84 Plus Calculator, Books A La Carte Edition (5th Edition)
Statistics for Psychology
Elementary Statistics Using Excel (6th Edition)
Statistics for Business and Economics (13th Edition)
Elementary Statistics
Statistics: The Art and Science of Learning from Data (4th Edition)


- In laparoscopic surgery, a video camera and several thin instruments are inserted into the patient's abdominal cavity. The surgeon uses the image from the video camera positioned inside the patient's body to perform the procedure by manipulating the instruments that have been inserted. The Top Gun Laparoscopic Skills and Suturing Program was developed to help surgeons develop the skill set necessary for laparoscopic surgery. Because of the similarity in many of the skills involved in video games and laparoscopic surgery, it was hypothesized that surgeons with greater prior video game experience might acquire the skills required in laparoscopic surgery more easily. Thirty‑three surgeons participated in the study and were classified into three categories, never used, under three hours, and three or more hours—depending on the daily number of hours they played video games at the height of their video game use. They also performed Top Gun drills and received a score based on the time to…arrow_forwardThe vintage Restaurant is located on Captiva Island, a resort community located near Fort Meyers, Florida. The restaurant, which is owned and operated by Karen Payne, has just completed its third year of operation. During this time, Karen sought to establish a reputation for the restaurant as a high-quality dining establishment that specializes in fresh seafood. The efforts made by Karen and her staff have proved successful, and her restaurant has become one of the best and fastest-growing restaurants on the island. Karen has just concluded that to plan better for the growth of the restaurant in the future, it is necessary to develop a system that will enable her to forecast food and beverage sales by the month for up to 1 year in advance. Karen has the following data available on the total food and beverage sales that were realized during the previous 3 years of operation. Food and Beverage Sales for the Vintage Restaurant ($1000s) Month First Year Second Year Third YearJanuary 242…arrow_forwardIn a classic study of infant attachment, Harlow (1959) placed infant monkeys in cages with two artificial surrogate mothers. One “mother” was made from bare wire mesh and contained a baby bottle from which the infants could feed. The other mother was made from soft terry cloth and did not provide any access to food. Harlow observed the infant monkeys and recorded how much time per day was spent with each mother. In atypical day, the infants spent a total of 18 hours clinging to one of the two mothers. If there were no preference between the two, you would expect the time to be divided evenly, with an average of μ=9 hours for each of the mothers. However, the typical monkey spent around 15 hours per day with the terry-cloth mother, indicating a strong preference for the soft, cuddly mother. Suppose a sample of n=9 infant monkeys averaged M=15.3 hours per day with SS=216 with the terry-cloth mother. Is this result sufficient to conclude that the monkeys spent significantly more time with…arrow_forward
 MATLAB: An Introduction with ApplicationsStatisticsISBN:9781119256830Author:Amos GilatPublisher:John Wiley & Sons Inc
 Probability and Statistics for Engineering and th...StatisticsISBN:9781305251809Author:Jay L. DevorePublisher:Cengage Learning
 Statistics for The Behavioral Sciences (MindTap C...StatisticsISBN:9781305504912Author:Frederick J Gravetter, Larry B. WallnauPublisher:Cengage Learning
 Elementary Statistics: Picturing the World (7th E...StatisticsISBN:9780134683416Author:Ron Larson, Betsy FarberPublisher:PEARSON
 The Basic Practice of StatisticsStatisticsISBN:9781319042578Author:David S. Moore, William I. Notz, Michael A. FlignerPublisher:W. H. Freeman
 Introduction to the Practice of StatisticsStatisticsISBN:9781319013387Author:David S. Moore, George P. McCabe, Bruce A. CraigPublisher:W. H. Freeman