Elementary Statistics: A Step By Step Approach
9th Edition
ISBN: 9780073534985
Author: Allan Bluman
Publisher: McGraw-Hill Science/Engineering/Math
Question
Book Icon
Chapter 9.5, Problem 1AC

1.

To determine

To write: The null hypothesis.

1.

Expert Solution
Check Mark

Answer to Problem 1AC

The null hypothesis is,

H0:σ12=σ22_.

Explanation of Solution

The given data shows that the data values from the automobile magazine of 1996 June. The article compared various parameters of U.S. and Japanese-made sports cars.

The greater variability in the price of automatic transmissions for the countries is tested between the Japanese cars and the U.S. cars.

Thus, the null hypothesis can be written as,

H0:σ12=σ22_.

2.

To determine

To identify: The test is used to test for any significant difference in the variances.

2.

Expert Solution
Check Mark

Answer to Problem 1AC

The test is used to test for any significant difference in the variances is F-test.

Explanation of Solution

Justification:

F-test:

The F-test is used to test for the significant difference in the variances.

Here, it is observed that F-test is used to test for any significant difference in the variances.

3.

To determine

To test: Whether there is any significant difference in the variability in the prices between the Japanese cars and the U.S. cars.

3.

Expert Solution
Check Mark

Answer to Problem 1AC

There is no sufficient evidence to support the claim that there is a significant difference in the variability in the prices between the German cars and the U.S. cars.

Explanation of Solution

Justification:

Step by step procedure for finding the sample variances using Minitab procedure is,

  • Choose Stat > Basic Statistics > Display Descriptive Statistics.
  • In Variables enter the columns Japanese and U.S. Cars.
  • Choose option statistics, and select Variance.
  • Click OK.

Output using Minitab procedure is,

Elementary Statistics: A Step By Step Approach, Chapter 9.5, Problem 1AC

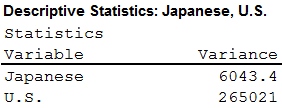
Here, the sample variances of U.S.(265,021)>Japanese(6,043.4). Thus, s12=6,043.4 and s22=265,021.

Where, s12 and σ12 represent the sample variance and population variance for the prices of cars in Japanese, s22 and σ22 represents the sample variance and population variance for the prices of cars in U.S. The samples sizes n1=6 and n2=6.

Here, the variability in the price of automatic transmissions for the countries is tested. Hence, the claim is that, σ12σ22.

Test statistic:

The formula to find the F-statistic is,

F=s12s22

Substitute s12=6,043.4 and s22=265,021

F=6,043.4265,021=0.0228

Thus, the F-statistic value is 0.0228.

Degrees of freedom:

The degrees of freedom are d.f.N=n11 and d.f.D=n21.

That is,

d.f.N=n11 =61=5

d.f.D=n21=61=5

Critical value:

The level of significance is α=0.05.

Divide the level of significance by 2.

That is,

α2=0.052=0.025

The critical F-value for a two-tailed test is obtained using the Table H: The F-Distribution with the level of significance 0.025.

Procedure:

  • Locate 5 in the degrees of freedom, denominator row of the Table H.
  • Obtain the value in the corresponding degrees of freedom, numerator column below 5.

That is, F0=14.94

Rejection region:

The null hypothesis would be rejected if F>14.94.

Conclusion:

Here, the F-value is lesser than the critical value.

That is, 0.0228<14.94.

Thus, it can be concluding that the null hypothesis is not rejected.

Hence, there is no sufficient evidence to support the claim that there is a significant difference in the variability in the prices between the Japanese cars and the U.S. cars.

4.

To determine

The effect of the small sample sizes have on the standard deviations.

4.

Expert Solution
Check Mark

Answer to Problem 1AC

The effect of the small sample sizes have on the standard deviations is the small sample sizes are impacted by outliers.

Explanation of Solution

Justification:

Here, it is observed that taking the small sample sizes gives the do not give appropriate results because the small sample sizes are impacted by outliers. Thus, it can be conclude that effect of the small sample sizes have on the standard deviations is the small sample sizes are impacted by outliers.

5.

To determine

To find: The degrees of freedom are used for the statistical test.

5.

Expert Solution
Check Mark

Answer to Problem 1AC

The degrees of freedom are used for the numerator and denominator is 5.

Explanation of Solution

Justification:

Form the part (3), it can be observed that the degrees of freedom are used for the numerator and denominator is 5.

6.

To determine

To check: Whether the two sets of data have significantly different variances without having significantly different means.

6.

Expert Solution
Check Mark

Answer to Problem 1AC

Yes, the two sets of data have significantly different variances without having significantly different means.

Explanation of Solution

From the given information, it can be observed that the mean of the two sets of data is same in the center but the standard deviations of the two sets are different.

Thus, it can be conclude that the two sets of data have significantly different variances without having significantly different means.

Want to see more full solutions like this?

Subscribe now to access step-by-step solutions to millions of textbook problems written by subject matter experts!

Chapter 9 Solutions

Elementary Statistics: A Step By Step Approach

Ch. 9.1 - For Exercises 5 through 16, perform each of the...Ch. 9.1 - Prob. 11ECh. 9.1 - For Exercises 5 through 16, perform each of the...Ch. 9.1 - Prob. 13ECh. 9.1 - For Exercises 5 through 16, perform each of the...Ch. 9.1 - Self-Esteem Scores In a study of a group of women...Ch. 9.1 - Ages of College Students The dean of students...Ch. 9.1 - Prob. 17ECh. 9.1 - Prob. 18ECh. 9.1 - Prob. 19ECh. 9.1 - Prob. 20ECh. 9.1 - Television Watching The average number of hours of...Ch. 9.1 - For Exercises 5 through 16, perform each of the...Ch. 9.1 - Prob. 23ECh. 9.1 - Home Prices According to the almanac, the average...Ch. 9.1 - Exam Scores at Private and Public Schools A...Ch. 9.1 - Sale Prices for Houses The average sales price of...Ch. 9.1 - Average Earnings for College Graduates The average...Ch. 9.2 - Too Long on the Telephone A company collects data...Ch. 9.2 - Prob. 1ECh. 9.2 - For these exercises, perform each of these steps....Ch. 9.2 - Prob. 3ECh. 9.2 - Prob. 4ECh. 9.2 - For these exercises, perform each of these steps....Ch. 9.2 - For these exercises, perform each of these steps....Ch. 9.2 - For these exercises, perform each of these steps....Ch. 9.2 - For these exercises, perform each of these steps....Ch. 9.2 - Prob. 9ECh. 9.2 - Find the 95% confidence interval for the...Ch. 9.2 - Prob. 11ECh. 9.2 - Prob. 12ECh. 9.2 - Prob. 13ECh. 9.2 - Prob. 14ECh. 9.2 - Prob. 15ECh. 9.2 - Ages of Homes Whiting, Indiana, leads the Top 100...Ch. 9.2 - Prob. 17ECh. 9.2 - Out-of-State Tuitions The out-of-state tuitions...Ch. 9.2 - Prob. 19ECh. 9.2 - For these exercises, perform each of these steps....Ch. 9.2 - Prob. 21ECh. 9.2 - Prob. 22ECh. 9.3 - Air Quality As a researcher for the EPA, you have...Ch. 9.3 - Classify each as independent or dependent samples....Ch. 9.3 - For Exercises 2 through 12, perform each of these...Ch. 9.3 - For Exercises 2 through 12, perform each of these...Ch. 9.3 - For Exercises 2 through 12, perform each of these...Ch. 9.3 - Prob. 5ECh. 9.3 - For Exercises 2 through 12, perform each of these...Ch. 9.3 - For Exercises 2 through 12, perform each of these...Ch. 9.3 - For Exercises 2 through 12, perform each of these...Ch. 9.3 - For Exercises 2 through 12, perform each of these...Ch. 9.3 - Toy Assembly Test An educational researcher...Ch. 9.3 - Prob. 11ECh. 9.3 - For Exercises 2 through 12, perform each of these...Ch. 9.3 - Prob. 13ECCh. 9.4 - Smoking and Education You are researching the...Ch. 9.4 - Prob. 1ECh. 9.4 - Find p and q for each. a. n = 36, X = 20 b. n =...Ch. 9.4 - Prob. 3ECh. 9.4 - Find each X, given p. a. p = 0.24, n = 300 b. p =...Ch. 9.4 - Prob. 5ECh. 9.4 - Find p and q. a. X1 = 6, n1 = 15, X2 = 9, n2 = 15...Ch. 9.4 - For Exercises 7 through 27, perform these steps....Ch. 9.4 - Prob. 8ECh. 9.4 - Prob. 9ECh. 9.4 - For Exercises 7 through 27, perform each of these...Ch. 9.4 - Prob. 11ECh. 9.4 - For Exercises 7 through 27, perform each of these...Ch. 9.4 - Prob. 13ECh. 9.4 - For Exercises 7 through 27, perform each of these...Ch. 9.4 - Prob. 15ECh. 9.4 - Smoking Survey National statistics show that 23%...Ch. 9.4 - For Exercises 7 through 27, perform each of these...Ch. 9.4 - For Exercises 7 through 27, perform each of these...Ch. 9.4 - Prob. 19ECh. 9.4 - For Exercises 7 through 27, perform these steps....Ch. 9.4 - For Exercises 7 through 27, perform these steps....Ch. 9.4 - For Exercises 7 through 27, perform these steps....Ch. 9.4 - For Exercises 7 through 27, perform these steps....Ch. 9.4 - For Exercises 7 through 27, perform these steps....Ch. 9.4 - For Exercises 7 through 27, perform these steps....Ch. 9.4 - For Exercises 7 through 27, perform these steps....Ch. 9.4 - For Exercises 7 through 27, perform these steps....Ch. 9.4 - Prob. 28ECCh. 9.5 - Prob. 1ACCh. 9.5 - When one is computing the F test value, what...Ch. 9.5 - Why is the critical region always on the right...Ch. 9.5 - What are the two different degrees of freedom...Ch. 9.5 - What are the characteristics of the F...Ch. 9.5 - Prob. 5ECh. 9.5 - Using Table H, find the critical value for each....Ch. 9.5 - Prob. 7ECh. 9.5 - Using Table H, find the P-value interval for each...Ch. 9.5 - Prob. 9ECh. 9.5 - For Exercises 9 through 24, perform the following...Ch. 9.5 - For Exercises 9 through 24, perform the following...Ch. 9.5 - For Exercises 9 through 24, perform the following...Ch. 9.5 - Prob. 13ECh. 9.5 - For Exercises 9 through 24, perform the following...Ch. 9.5 - For Exercises 9 through 24, perform the following...Ch. 9.5 - For Exercises 9 through 24, perform the following...Ch. 9.5 - Prob. 17ECh. 9.5 - For Exercises 9 through 24, perform the following...Ch. 9.5 - For Exercises 9 through 24, perform the following...Ch. 9.5 - For Exercises 9 through 24, perform the following...Ch. 9.5 - Prob. 21ECh. 9.5 - For Exercises 9 through 24, perform the following...Ch. 9.5 - Prob. 23ECh. 9.5 - For Exercises 9 through 24, perform the following...Ch. 9 - For each exercise, perform these steps. Assume...Ch. 9 - Prob. 9.1.2RECh. 9 - Prob. 9.2.3RECh. 9 - Prob. 9.2.4RECh. 9 - For each exercise, perform these steps. Assume...Ch. 9 - Prob. 9.2.6RECh. 9 - High and Low Temperatures March is a month of...Ch. 9 - Testing After Review A statistics class was given...Ch. 9 - Lay Teachers in Religious Schools A study found a...Ch. 9 - Prob. 9.4.10RECh. 9 - Prob. 9.5.11RECh. 9 - Heights of World Famous Cathedrals The heights (in...Ch. 9 - Prob. 9.5.13RECh. 9 - Prob. 1DACh. 9 - Prob. 2DACh. 9 - Prob. 3DACh. 9 - Prob. 4DACh. 9 - Prob. 5DACh. 9 - Prob. 1CQCh. 9 - Prob. 2CQCh. 9 - Prob. 3CQCh. 9 - Prob. 4CQCh. 9 - Prob. 5CQCh. 9 - To test the equality of two proportions, you would...Ch. 9 - Prob. 7CQCh. 9 - Prob. 8CQCh. 9 - Complete these statements with the best answer. 9....Ch. 9 - Prob. 10CQCh. 9 - Prob. 11CQCh. 9 - Prob. 12CQCh. 9 - Prob. 13CQCh. 9 - Prob. 14CQCh. 9 - Prob. 15CQCh. 9 - Prob. 16CQCh. 9 - For these exercises, perform each of these steps....Ch. 9 - Prob. 18CQCh. 9 - Prob. 19CQCh. 9 - Mathematical Skills In an effort to improve the...Ch. 9 - Prob. 21CQCh. 9 - Prob. 22CQCh. 9 - Prob. 23CQCh. 9 - Prob. 24CQCh. 9 - Prob. 25CQ
Knowledge Booster
Background pattern image
Recommended textbooks for you
Text book image
MATLAB: An Introduction with Applications
Statistics
ISBN:9781119256830
Author:Amos Gilat
Publisher:John Wiley & Sons Inc
Text book image
Probability and Statistics for Engineering and th...
Statistics
ISBN:9781305251809
Author:Jay L. Devore
Publisher:Cengage Learning
Text book image
Statistics for The Behavioral Sciences (MindTap C...
Statistics
ISBN:9781305504912
Author:Frederick J Gravetter, Larry B. Wallnau
Publisher:Cengage Learning
Text book image
Elementary Statistics: Picturing the World (7th E...
Statistics
ISBN:9780134683416
Author:Ron Larson, Betsy Farber
Publisher:PEARSON
Text book image
The Basic Practice of Statistics
Statistics
ISBN:9781319042578
Author:David S. Moore, William I. Notz, Michael A. Fligner
Publisher:W. H. Freeman
Text book image
Introduction to the Practice of Statistics
Statistics
ISBN:9781319013387
Author:David S. Moore, George P. McCabe, Bruce A. Craig
Publisher:W. H. Freeman