Concept explainers
Videos
(a)
Plot the data and the regression line on the same axes. Does the line fit the data well?
(a)
Answer to Problem 1P
Yes, the line fits the data well
Explanation of Solution
Given information:
Table gives the gross world product, G, which measures output of goods and services. If t is in years since 1950, the regression line these data is
G in tillions of 1999 dollars.
| Year | 1950 | 1960 | 1970 | 1980 | 1990 | 2000 |
| G | 6.4 | 10.0 | 16.3 | 23.6 | 31.9 | 43.2 |
Calculation:
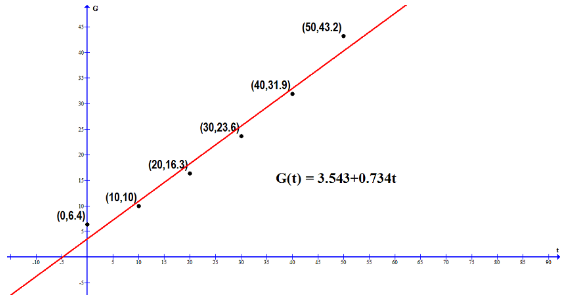
Yes, the line fits the data well (is in fact the linear regression line) with
(b)
Interpret the slope of the line in terms of gross world product.
(b)
Explanation of Solution
The gross world product, G, which measures global output of goods and services is given by
Hence, the slope of G ( t ) indicates that gross world product increases by 0.734 trillion dollars every year.
(c)
Use the regression line to estimate gross world product in 2005 and in 2020. Comment on your confidence in the two predictions.
(c)
Answer to Problem 1P
The gross world product in 2005 = 1475.213 trillion dollars
The gross world product in 2020 = 1486.223 trillion dollars
Both predictions cannot be made confidently.
Explanation of Solution
Given information:
Table A.5 gives the gross world product, G, which measures output of goods and services. If t is in years since 1950, the regression line these data is
| Year | 1950 | 1960 | 1970 | 1980 | 1990 | 2000 |
| G | 6.4 | 10.0 | 16.3 | 23.6 | 31.9 | 43.2 |
Calculation:
The gross world product, G, which measures global output of goods and services is given by
Both predictions cannot be made confidently because:
- Uniform increase in gross world product every year is highly unlikely in actual scenario.
- A recession (for example the one in 2009) can also lead to decrease in gross world product.
Thus, the gross world product in 2005 = 1475.213 trillion dollars
The gross world product in 2020 = 1486.223 trillion dollars
Both predictions cannot be made confidently.
Want to see more full solutions like this?
Chapter A Solutions
EBK APPLIED CALCULUS, ENHANCED ETEXT


- Find the equation of the regression line for the following data set. x 1 2 3 y 0 3 4arrow_forwardbThe average rate of change of the linear function f(x)=3x+5 between any two points is ________.arrow_forwardXYZ Corporation Stock Prices The following table shows the average stock price, in dollars, of XYZ Corporation in the given month. Month Stock price January 2011 43.71 February 2011 44.22 March 2011 44.44 April 2011 45.17 May 2011 45.97 a. Find the equation of the regression line. Round the regression coefficients to three decimal places. b. Plot the data points and the regression line. c. Explain in practical terms the meaning of the slope of the regression line. d. Based on the trend of the regression line, what do you predict the stock price to be in January 2012? January 2013?arrow_forward
- Life Expectancy The following table shows the average life expectancy, in years, of a child born in the given year42 Life expectancy 2005 77.6 2007 78.1 2009 78.5 2011 78.7 2013 78.8 a. Find the equation of the regression line, and explain the meaning of its slope. b. Plot the data points and the regression line. c. Explain in practical terms the meaning of the slope of the regression line. d. Based on the trend of the regression line, what do you predict as the life expectancy of a child born in 2019? e. Based on the trend of the regression line, what do you predict as the life expectancy of a child born in 1580?2300arrow_forwardDemand for Candy Bars In this problem you will determine a linear demand equation that describes the demand for candy bars in your class. Survey your classmates to determine what price they would be willing to pay for a candy bar. Your survey form might look like the sample to the left. a Make a table of the number of respondents who answered yes at each price level. b Make a scatter plot of your data. c Find and graph the regression line y=mp+b, which gives the number of respondents y who would buy a candy bar if the price were p cents. This is the demand equation. Why is the slope m negative? d What is the p-intercept of the demand equation? What does this intercept tell you about pricing candy bars? Would you buy a candy bar from the vending machine in the hallway if the price is as indicated. Price Yes or No 50 75 1.00 1.25 1.50 1.75 2.00arrow_forward
 Functions and Change: A Modeling Approach to Coll...AlgebraISBN:9781337111348Author:Bruce Crauder, Benny Evans, Alan NoellPublisher:Cengage Learning
 Algebra and Trigonometry (MindTap Course List)AlgebraISBN:9781305071742Author:James Stewart, Lothar Redlin, Saleem WatsonPublisher:Cengage Learning
 Algebra & Trigonometry with Analytic GeometryAlgebraISBN:9781133382119Author:SwokowskiPublisher:Cengage
 Glencoe Algebra 1, Student Edition, 9780079039897...AlgebraISBN:9780079039897Author:CarterPublisher:McGraw Hill
 College AlgebraAlgebraISBN:9781305115545Author:James Stewart, Lothar Redlin, Saleem WatsonPublisher:Cengage Learning