
Introductory Statistics, Books a la Carte Plus NEW MyLab Statistics with Pearson eText -- Access Card Package (10th Edition)
10th Edition
ISBN: 9780134270364
Author: Neil A. Weiss
Publisher: PEARSON
expand_more
expand_more
format_list_bulleted
Concept explainers
Videos
Textbook Question
Chapter B.6, Problem 119E
Suppose that x1 x2, x3, and x4 are predictor variables for a response variable y. The table that starts below gives the value of R2,
- a. Use the maximum-R2 criterion to obtain a regression equation for these data.
- b. Use the adjusted-R2 criterion to obtain a regression equation for these data.
- c. Use the Mallows’ Cp criterion to obtain a regression equation for these data.
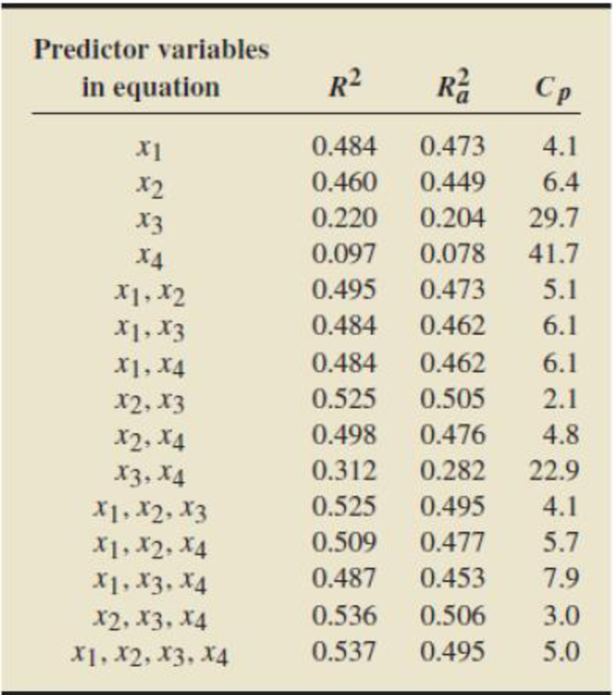
- d. Are the regression equations obtained in parts (a), (b), and (c) the same?
Expert Solution & Answer
Want to see the full answer?
Check out a sample textbook solution
Students have asked these similar questions
A student used multiple regression analysis to study how family spending (y) is influenced by income
(X1), family size (x2), and additions to savings (x3). The variables y, x1, and x3 are measured in thousands
of dollars. The following results were obtained.
A real estate analyst has developed a multiple regression line, y = 60 + 0.068 x1 – 2.5 x2, to predict y = the market price of a home (in $1,000s), using independent variables, x1 = the total number of square feet of living space, and x2 = the age of the house in years. The regression coefficient of x1 suggests this: __________.
The addition of 1 square foot area of living space results in a predicted increase of $68.00 in the price of the home if the age of the home were held constant
The addition of 1 square foot area of living space results in a predicted increase of $0.068 in the price of the home for homes of different ages
The addition of 1 square foot area of living space results in a predicted increase of $68.00 in the price of the home with the age of the home allowed to vary
The addition of 1 square foot area of living space results in a predicted increase of $0.068 in the price of the home if the age of the home were held constant
A real estate analyst has developed a multiple regression line, y = 60 + 0.068 x1 – 2.5 x2, to predict y = the market price of a home (in $1,000s), using independent variables, x1 = the total number of square feet of living space, and x2 = the age of the house in years. The regression coefficient of x2 suggests this: __________.
If the square feet area of living space is kept constant, a 1 year increase in the age of the homes will result in a predicted drop of $2500 in the price of the homes
If the square feet area of living space is kept constant, a 1 year increase in the age of the homes will result in a predicted increase of $2500 in the price of the homes
Whatever be the square feet area of the living space, a 1 year increase in the age of the homes will result in a predicted increase of $2500 in the price of the homes
Whatever be the square feet area of the living space, a 1 year increase in the age of the homes will result in a predicted drop of $2500 in the price of the homes
Chapter B Solutions
Introductory Statistics, Books a la Carte Plus NEW MyLab Statistics with Pearson eText -- Access Card Package (10th Edition)
Ch. B.1 - Regarding the regression of a response variable,...Ch. B.1 - Fill in the blanks. a. The assumption that all...Ch. B.1 - Answer true or false to each of the following...Ch. B.1 - Prob. 4ECh. B.1 - In each of Exercises B.5B.14, a. decide whether...Ch. B.1 - Prob. 6ECh. B.1 - Prob. 7ECh. B.1 - In each of Exercises B.5B.14, a. decide whether...Ch. B.1 - In each of Exercises B.5B.14, a. decide whether...Ch. B.1 - In each of Exercises B.5B.14, a. decide whether...
Ch. B.1 - In each of Exercises B.5B.14, a. decide whether...Ch. B.1 - Prob. 12ECh. B.1 - In each of Exercises B.5B.14, a. decide whether...Ch. B.1 - In each of Exercises B.5B.14, a. decide whether...Ch. B.1 - Consider the scatterplot of y versus x in Output...Ch. B.1 - Consider the scatterplot of y versus x in Output...Ch. B.1 - Prob. 17ECh. B.1 - Prob. 18ECh. B.1 - If one or both of the assumptions of...Ch. B.1 - Prob. 20ECh. B.1 - Prob. 21ECh. B.1 - Prob. 22ECh. B.1 - Prob. 23ECh. B.1 - Gasoline Mileage Ratings. Gasoline mileage and...Ch. B.1 - Hip Fracture Rates. In the paper Very Low Rates of...Ch. B.1 - Prob. 26ECh. B.1 - Prob. 27ECh. B.1 - Prob. 28ECh. B.1 - Prob. 29ECh. B.1 - Gasoline Mileage Ratings. Refer to Exercise B.24,...Ch. B.1 - Hip Fracture Rates. Refer to Exercise B.25, where...Ch. B.1 - Drosophila Life-span. In the paper Extended...Ch. B.1 - Protein Content of Wheat. In their text, Methods...Ch. B.1 - Pine Tree Volume. Table B.2 on page B-5 provides...Ch. B.2 - Give an example of a. a second-degree polynomial...Ch. B.2 - In the polynomial regression equation y = 8 + 3x ...Ch. B.2 - Answer true or false to each of the following...Ch. B.2 - Explain why it is difficult to interpret the...Ch. B.2 - Fill in the blanks. a. A predictor variable is...Ch. B.2 - Answer true or false to each of the following...Ch. B.2 - Refer to the scatterplots in Outputs B.32(a) and...Ch. B.2 - Fill in the blanks. a. In the _______ method for...Ch. B.2 - Answer true or false to each of the following...Ch. B.2 - Stopping Distance. In their text Methods of...Ch. B.2 - Hour of Birth. In the paper increased Frequency of...Ch. B.2 - Silica Gel. Silica gel is a substance that absorbs...Ch. B.2 - Note: The data for the Using Technology exercises...Ch. B.2 - Hour of Birth. Refer to Exercise B.45, where the...Ch. B.2 - Silica Gel. Refer to Exercise B.46, where the...Ch. B.2 - Gasoline Mileage Ratings. Refer to Exercise B.24...Ch. B.2 - Protein Content of Wheat. Refer to Exercise B.33...Ch. B.2 - Satellite Orbits. Each issue of the magazine Ad...Ch. B.2 - Pine Tree Volume. In Example B.6 on page B-4, we...Ch. B.3 - Explain the difference between a quantitative...Ch. B.3 - In predicting a person's income, identify two...Ch. B.3 - In predicting the change in blood pressure for...Ch. B.3 - Fill in the blanks. a. A ___ predictor variable is...Ch. B.3 - Prob. 59ECh. B.3 - Answer true or false to each of the following...Ch. B.3 - For the regression equation y = 15 + 2x1 + 4x2 ...Ch. B.3 - Refer to Exercise B.61: a. Do the slopes of the...Ch. B.3 - Consider the regression equation y = 0 + 1 x1+ 2x2...Ch. B.3 - Prob. 64ECh. B.3 - Prob. 65ECh. B.3 - Prob. 66ECh. B.3 - Home Sale Prices. Refer to Example B.18 on page...Ch. B.3 - Mental Tasks and Drugs. In the text Statistical...Ch. B.3 - Gasoline Mileage Ratings. Refer to Exercise B.66...Ch. B.3 - Home Sale Prices. Refer to Exercise B.67 regarding...Ch. B.3 - Mental Tasks and Drugs. Refer to Exercise B.68...Ch. B.3 - Hip Fracture Rates. Refer to Exercise B.25 on page...Ch. B.3 - Television Viewing. The results of a study on...Ch. B.3 - Glue Strength. In the text Quality Control and...Ch. B.4 - Explain why the interpretation of the regression...Ch. B.4 - Answer true or false to each of the following...Ch. B.4 - Explain what is meant by multicollinearity.Ch. B.4 - Fill in the blanks. a. Consider a regression model...Ch. B.4 - Prob. 79ECh. B.4 - Prob. 80ECh. B.4 - Fill in the blanks. a. If predictor variable x1...Ch. B.4 - Answer true or false to each of the following...Ch. B.4 - State four ways to detect the presence of...Ch. B.4 - Prob. 84ECh. B.4 - Prob. 85ECh. B.4 - Prob. 86ECh. B.4 - Prob. 87ECh. B.4 - Prob. 88ECh. B.4 - Graduation Rates. Refer to Exercise B.86, where we...Ch. B.4 - Prob. 90ECh. B.4 - Gasoline Mileage Ratings. Refer to Exercise B.84,...Ch. B.4 - Graduation Rules. Refer to Exercise B.86, where we...Ch. B.5 - Explain what is meant by the variable selection...Ch. B.5 - Prob. 94ECh. B.5 - Fill in the blanks. a. In the forward selection...Ch. B.5 - Prob. 96ECh. B.5 - Answer true or false to each of the following...Ch. B.5 - Prob. 98ECh. B.5 - Prob. 99ECh. B.5 - Prob. 100ECh. B.5 - Prob. 101ECh. B.5 - Suppose that x1, x2, x3, and x4 are predictor...Ch. B.5 - Prob. 103ECh. B.5 - Graduation Rates. Refer to Exercise B.92 on page...Ch. B.5 - Home Sale Prices. In Example B. 18 on page B-67,...Ch. B.5 - Home Sale Prices. In Example B.18 on page B-67, we...Ch. B.5 - Infant Mortality Rates. In the article Children's...Ch. B.6 - Consider a multiple linear regression relating the...Ch. B.6 - Prob. 109ECh. B.6 - Prob. 110ECh. B.6 - Answer true or false to each of the following...Ch. B.6 - Explain the similarities and differences between...Ch. B.6 - Fill in the blanks. a. In the Mallows Cp...Ch. B.6 - Answer true or false to each of the following...Ch. B.6 - Gasoline Mileage Ratings. Refer to Exercise B.84...Ch. B.6 - Advertising and Sales. Refer to Exercise B.85 on...Ch. B.6 - Graduation Rates. Refer to Exercise B.86 on page...Ch. B.6 - Suppose that x1, x2, x3, and x4 are predictor...Ch. B.6 - Suppose that x1 x2, x3, and x4 are predictor...Ch. B.6 - Gasoline Mileage Ratings. Refer to Exercise B.91...Ch. B.6 - Graduation Rates. Refer to Exercise B.92 on page...Ch. B.6 - Home Sale Prices. Refer to Exercise B.105 on page...Ch. B.6 - Body Fat. Refer to Exercise B.106 on page B-143,...Ch. B.6 - Infant Mortality Rates. Refer to Exercise B.107 on...Ch. B.7 - List six problems that can arise in the collection...Ch. B.7 - Prob. 126ECh. B.7 - Prob. 127ECh. B.7 - Give an example of how a nonrepresentative sample...Ch. B.7 - Discuss the effect on a regression analysis of not...Ch. B.7 - Explain how multicollinearity can adversely affect...Ch. B.7 - Briefly describe what is meant by the problem of...Ch. B.7 - Answer true or false to each of the following...Ch. B.7 - Prob. 133ECh. B.7 - Discuss the advantages of using data collected...Ch. B.7 - Describe the potential effects of outliers on...Ch. B.7 - Prob. 136ECh. B.7 - Regarding regression analysis: a. What assumptions...Ch. B.7 - Answer true or false to each of the following...Ch. B.7 - Answer true or false to each of the following...Ch. B.7 - Discuss what G. E. P. Box might have meant when he...Ch. B.7 - Regarding model validation in regression: a. What...Ch. B - Explain what is meant when we say that a nonlinear...Ch. B - Answer true or false to the following statements...Ch. B - Prob. 3RPCh. B - Prob. 4RPCh. B - Answer true or false to each of the following...Ch. B - Paper Strength. In their text, Introduction to...Ch. B - Answer true or false to each of the following...Ch. B - Prob. 8RPCh. B - Explain what is meant when we say that a...Ch. B - OUTPUT B.95 Output for Problem 10 Regression...Ch. B - In regressing a response variable on several...Ch. B - Answer true or false to each of the following...Ch. B - Fill in the blanks. a. Multicollinearity is...Ch. B - Prob. 14RPCh. B - Explain why selecting a regression equation using...Ch. B - Answer true or false to each of the following...Ch. B - Fill in the blanks. a. In the _____ method, we...Ch. B - Patent Production. In the report The State New...Ch. B - Prob. 19RPCh. B - Prob. 20RPCh. B - Patent Production. Refer to Problem 18. where we...Ch. B - Prob. 22RPCh. B - Prob. 23RPCh. B - What are the possible consequences of the presence...Ch. B - Windmill Output. Refer to Problem 3, where we...Ch. B - Paper Strength. Refer to Problem 6, where we...Ch. B - Diabetes. Refer to Problem 10, where we considered...Ch. B - Hospital Stalling. Refer to Problem 14, where we...Ch. B - Patent Production. Refer to Problem 18, where we...Ch. B - Patent Production. Refer to Problem 29, where we...Ch. B - Recall from Chapter 1 of your text that the Focus...Ch. B - At the beginning of this module on page B-l, we...
Knowledge Booster


Learn more about
Need a deep-dive on the concept behind this application? Look no further. Learn more about this topic, statistics and related others by exploring similar questions and additional content below.Similar questions
- Cellular Phone Subscribers The table shows the numbers of cellular phone subscribers y in millions in the United States from 2008 through 2013. Source: CTIA- The Wireless Association Year200820092010201120122013Number,y270286296316326336 (a) Find the least squares regression line for the data. Let x represent the year, with x=8 corresponding to 2008. (b) Use the linear regression capabilities of a graphing utility to find a linear model for the data. How does this model compare with the model obtained in part a? (c) Use the linear model to create a table of estimated values for y. Compare the estimated values with the actual data.arrow_forwardA student used multiple regression analysis to study how family spending (y) is influenced by income (x1), family size (x2), and additions to savings (x3). The variables y, x1, and x3 are measured in thousands of dollars. The following results were obtained shared in the picture. Write out the estimated regression equation for the relationship between the variables. Compute coefficient of determination. What can you say about the strength of this relationship? Carry out a test to determine whether y is significantly related to the independent variables. Use a 5% level of significance. Carry out a test to see if x3 and y are significantly related. Use a 5% level of significance.arrow_forwardThe owner of Showtime Movie Theaters, Inc., used multiple regression analysis to predict gross revenue (y) as a function of television advertising (x1) and newspaper advertising (x2). Values of y, x1, and x2 are expressed in thousands of dollars. Weekly Gross Television Newspaper Revenue Advertising Advertising 96 5.0 1.5 90 2.0 2.0 95 4.0 1.5 92 2.5 2.5 95 3.0 3.3 94 3.5 2.3 94 2.5 4.2 94 3.0 2.5 a. What is the gross revenue expected for a week where $3,500 is spent on television (x1 =3.5) and $1,800 is spent on newspaper advertising (x2= 1.8)(to 3 decimals)? b. Provide a 95 prediction interval for next week's revenue, assuming that the advertising expenditures will be allocated as in part (a) (to 2 decimals). (_____ thousand, ______ thousand)arrow_forward
- The accompanying data are the caloric contents and the sugar contents (in grams) of 11 high-fiber breakfast cereals. Find the equation of the regression line. Then construct a scatter plot of the data and draw the regression line. Then use the regression equation to predict the value of y for each of the given x-values, if meaningful. If the x-value is not meaningful to predict the value of y, explain why not. Calories, x Sugar, y 140 6 200 10 160 6 160 9 170 10 180 16 190 13 210 18 190 19 170 10 170 10 The equation of the regression line is ŷ = ______ x + ______ (Round the slope to three decimal places as needed. Round the y-intercept to two decimal places as needed.) (a) x = 150 cal, (b) x = 90 cal, (c) x = 175 cal, (d) x = 208 cal…arrow_forwardA student used multiple regression analysis to study how family spending (y) is influenced by income (x1), family size (x2), and additions to savings (x3). The variables y, x1, and x3 are measured in thousandsof dollars. The following results were obtained shown in the image,a. Write out the estimated regression equation for the relationship between the variables. b. Compute coefficient of determination. What can you say about the strength of this relationship? c. Carry out a test to determine whether y is significantly related to the independent variables. Use a 5% level of significance and Carry out a test to see if x3 and y are significantly related. Use a 5% level of significance.arrow_forwardThe accompanying data are the caloric contents and the sugar contents (in grams) of 11 high-fiber breakfast cereals. Find the equation of the regression line. Then construct a scatter plot of the data and draw the regression line. Then use the regression equation to predict the value of y for each of the given x-values, if meaningful. If the x-value is not meaningful to predict the value of y, explain why not. The table of caloric and sugar contents is shown in the attached image. (a) x= 150 cal (b) x=90 cal (c) x= 175 cal (d) x= 208 calarrow_forward
- In order for applicants to work for the foreign-service department, they must take a test in the language of the country where they plan to work. The data below shows the relationship between the number of years that applicants have studied a particular language and the grades they received on the proficiency exam. Find the equation of the regression line for the given data.arrow_forwardThe value of a sports franchise is directly related to the amount of revenue that a franchise can generate. The accompanying data table gives the value and the annual revenue for 15 major sport teams. Suppose you want to develop a simple linear regression model to predict franchise value based on annual revenue generated. d. Predict the mean franchise value (in millions of dollars) of a sports team that generates $250 million of annual revenue. (Round to the nearest integer as needed.)arrow_forwardUse the p-value criterion to find the best model for predicting the number of points scored per game by football teams using the accompanying National Football League Data. Does the model make logical sense? Click the icon to view the National Football Leaque Data. Determine the best multiple regression model. Let X, represent Rushing Yards, let X, represent Passing Yards, let X, represent Penalties, let X, represent Interceptions, and let Xg represent Fumbles. Enter the terms of the equation so that the Xy-values are in ascending numeral order by base. Select the correct choice below and fill in the answer boxes within your choice. (Type an integer or decimal rounded to three decimal places as needed.) O A. Points/Game = O B. Points/Game = Oc. Points/Game = OD. Points/Game = + ( DX Points/Game = O E.arrow_forward
- i need a simple linear regression equation for miles per gallon as the response variable and weight as the predictor variable.arrow_forwardAn independent mail delivery service wants to study factors that affect the daily gas usage of its delivery trucks. Using data collected from different trucks on various days, a company analyst uses software to fit a regression model of the following form. y = 13 +8x, -1.1x, + 2x3 +0.04.x, In this model are the following variables. y= volume of gasoline used (in gallons) X1 weight of truck (in tons) x, = tire pressure (in psi, pounds per square inch) weight of initial pačkage load (in hundreds of pounds) X4 total distance driven while delivering packages (in miles) Answer the questions below for the interpretation of the coefficient of x, in this model. (a) Holding the other variables fixed, what is the average change in daily fuel used for each additional ton that a truck weighs? gallon(s) (b) Is this change an increase or a decrease? O increase O decrease Activate Windoarrow_forwardUse the p-value criterion to find the best model for predicting the number of points scored per game by football teams using the accompanying National Football League Data. Does the model make logical sense? E Click the icon to view the National Football League Data. Determine the best multiple regression model. Let X, represent Rushing Yards, let X, represent Passing Yards, let X3 represent Penalties, let X4 represent Interceptions, and let X5 represent Fumbles. Enter the terms of the equation so that the Xy-values are in ascending numeral order by base. Select the correct choice below and fill in the answer boxes within your choice. (Type an integer or decimal rounded to three decimal places as needed.) OA Points/Game = Dx O B. Points/Game = + Oc. Points/Game = O D. Points/Game = Points/Game = OE.arrow_forward
arrow_back_ios
SEE MORE QUESTIONS
arrow_forward_ios
Recommended textbooks for you
 Elementary Linear Algebra (MindTap Course List)AlgebraISBN:9781305658004Author:Ron LarsonPublisher:Cengage Learning
 Algebra & Trigonometry with Analytic GeometryAlgebraISBN:9781133382119Author:SwokowskiPublisher:Cengage
 Functions and Change: A Modeling Approach to Coll...AlgebraISBN:9781337111348Author:Bruce Crauder, Benny Evans, Alan NoellPublisher:Cengage Learning
Elementary Linear Algebra (MindTap Course List)
Algebra
ISBN:9781305658004
Author:Ron Larson
Publisher:Cengage Learning
Algebra & Trigonometry with Analytic Geometry
Algebra
ISBN:9781133382119
Author:Swokowski
Publisher:Cengage
Functions and Change: A Modeling Approach to Coll...
Algebra
ISBN:9781337111348
Author:Bruce Crauder, Benny Evans, Alan Noell
Publisher:Cengage Learning
Correlation Vs Regression: Difference Between them with definition & Comparison Chart; Author: Key Differences;https://www.youtube.com/watch?v=Ou2QGSJVd0U;License: Standard YouTube License, CC-BY
Correlation and Regression: Concepts with Illustrative examples; Author: LEARN & APPLY : Lean and Six Sigma;https://www.youtube.com/watch?v=xTpHD5WLuoA;License: Standard YouTube License, CC-BY