The most appropriate graph of the equation
Answer to Problem 1E
Solution:
The rectangular view
Explanation of Solution
Given:
The given equation is,
The rectangular view given are,
(a)
(b)
(c)
(d)
Approach:
The graph of the equation using graphing calculator in the given rectangular view is constructed on the basis of the following steps:
Step 1: Press the key
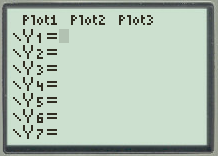
Figure
Step 2: Press the key
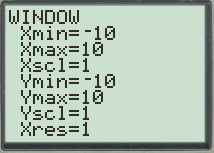
Figure
Step 3: Press the key
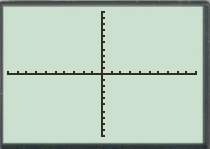
Figure
Calculation:
Case (a):
Write the given equation in the graphing calculator,
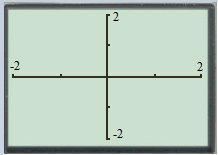
Start with the viewing rectangle
Set,
The result graph is as shown below,
Figure
The resulting graph is blank. The graph lies entirely outside the view of window. So this rectangular view is not appropriate.
Case (b):
Write the given equation in the graphing calculator,
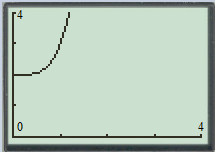
Start with the viewing rectangle
Set,
The result graph is as shown below,
Figure
The resulting graph only shows some portion of the graph. Some turning point in the graph is not visible in the graph. So this rectangular view is also not appropriate.
Case (c):
Write the given equation in the graphing calculator,
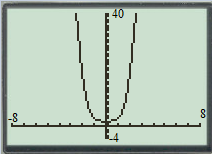
Start with the viewing rectangle
Set,
The result graph is as shown below,
Figure
The resulting graph gives the complete view of the graph. Thus, this rectangular view is appropriate.
Case (d):
Write the given equation in the graphing calculator,
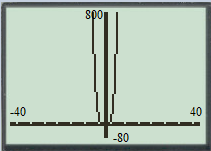
Start with the viewing rectangle
Set,
The result graph is as shown below,
Figure
The resulting graph does not show the
Therefore, the rectangular view
Conclusion:
Hence, the rectangular view
Want to see more full solutions like this?
Chapter C Solutions
Algebra and Trigonometry (MindTap Course List)

- Suppose we want to graph an equation in x and y. a If we replace x by x3, the graph of the equation is shifted to the _____ by 3 units. If we replace x by x+3, the graph of the equation is shifted to the ____ by 3 units. b If we replace y by y1, the graph of the equation is shifted ______ by 1 unit. If we replace y by y+1, the graph of the equation is shifted _______ by 1 unitarrow_forward0<x<2pi F(x)=-4cosx G(x)=2cosx+3 graph f(x) and g(x) on the same coordinate system for 0<x<2pi and solve f(x)=g(x) on [0,2pi] and label point of intersection on the graph (both x and y values)arrow_forwardx) Consider the graphs of y1 = f(x) and y2 = f(2x + 7). Make a prediction about how these graphs are related. In particular what does the graph of y2 = f(2x + 7) look like in comparison to y1 = f(x)? y) Suppose that, in addition, we know that f(x) = x2. Graph y1 = f(x) and y2 = f(2x + 7). Make sure you measure the horizontal distance between the vertices of the two graphs. How do your findings fit with your expectations from part a)? z) When we graph y = Af(Bx + C) + D, based on our knowledge of the graph of y = f(x) and assuming that A, B, C and D are constants, does the order in which we carry out the four transformations matter? What order would you recommend?arrow_forward
- World Population A low-projection scenario forworld population for 1995–2150 by the United Nationsis given by the function y = -0.36x2 + 38.52x +5822.86, where x is the number of years after 1990and the world population is measured in millions ofpeople.a. Find the input and output at the vertex of thegraph of this model.b. Interpret the values from part (a).c. For what years after 1995 does this model predictthat the population will increase?arrow_forward(a) Graph f1x2 = 3-x+1 and g1x2 = 3x-2 on the same Cartesian plane.(b) Shade the region bounded by the y-axis, f1x2 = 3-x+1, and g1x2 = 3x-2 on the graph drawn in part (a).(c) Solve f1x2 = g1x2 and label the point of intersectionon the graph drawn in part (a).arrow_forwardThe graph of a function f is given. The x y-coordinate plane is given. A curve with 3 parts is graphed. The first part is linear, enters the window in the second quadrant, goes down and right, crosses the x-axis at approximately x = −0.33, crosses the y-axis at y = −0.25, and ends at the open point (1, −1). The second part is the point (1, 1). The third part is linear, begins at the open point (1, −1), goes up and right, crosses the x-axis at x = 2, and exits the window in the first quadrant. Determine whether f is continuous on its domain. continuous not continuous If it is not continuous on its domain, say why. lim x→1+ f(x) ≠ lim x→1− f(x), so lim x→1 f(x) does not exist. The function is not defined at x = 1. The graph is continuous on its domain. lim x→1 f(x) = −1 ≠ f(1)arrow_forward
- Two insects are crawling along different lines in three-space. At time t (in minutes), the first insect is at the point (x, y, z) on the line x = 6 + t, y = 8 − t, z = 3 + t. Also, at time t, the second insect is at the point (x, y, z) on the line x = 1 + t, y = 2 + t, z = 2t. Assume that distances are given in inches. (a) Find the distance between the two insects at time t = 0. (b) Use a graphing utility to graph the distance between the insects from t = 0 to t = 10. (c) Using the graph from part (b), what can you conclude about the distance between the insects? (d) How close to each other do the insects get?arrow_forward1st graph.) A coordinate plane has "People (in thousands)" on the horizontal axis and "Years since 2000" on the vertical axis. The origin is at (0, 20000). The curve enters the window at approximately 1.8 on the positive horizontal axis, goes up and right becoming less steep, changes direction at the approximate point (10, 46600), goes down and right becoming more steep, and exits the window at approximately 18.2 on the positive horizontal axis. 2nd graph.) A coordinate plane has "Years since 2000" on the horizontal axis and "People (in thousands)" on the vertical axis. The origin is at (0, 20000). The curve enters the window at approximately 2.7 on the positive horizontal axis, goes up and right becoming less steep, changes direction at the approximate point (12, 46600), goes down and right becoming more steep, and exits the window at approximately 21.3 on the positive horizontal axis. 3rd graph.) A coordinate plane has "Years since 2000" on the horizontal axis and "People (in…arrow_forward
 Algebra and Trigonometry (MindTap Course List)AlgebraISBN:9781305071742Author:James Stewart, Lothar Redlin, Saleem WatsonPublisher:Cengage Learning
 Big Ideas Math A Bridge To Success Algebra 1: Stu...AlgebraISBN:9781680331141Author:HOUGHTON MIFFLIN HARCOURTPublisher:Houghton Mifflin Harcourt
 Algebra & Trigonometry with Analytic GeometryAlgebraISBN:9781133382119Author:SwokowskiPublisher:Cengage
 Intermediate AlgebraAlgebraISBN:9781285195728Author:Jerome E. Kaufmann, Karen L. SchwittersPublisher:Cengage Learning