Videos
APPLICATIONS
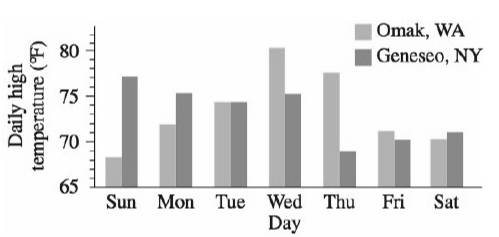
Temperature Variation The bar graph shows the daily high temperatures for Omak, Washington, and Geneseo, New York, during a certain week in June. Let
Want to see the full answer?
Check out a sample textbook solution
Chapter P Solutions
Algebra and Trigonometry (MindTap Course List)


- APPLICATIONS Power Consumption The figure shows the power consumption in San Francisco for a day in September P is measured in megawatts; t is measured in hours starting at midnight. a What was the power consumption at 6:A.M.? At 6:00 P.M. ? b When was the power consumption the lowest? c When was the power consumption the highest? d Find the net change in the power consumption from 9:00 A.M. to 7:00 P.M.arrow_forwardTemperature The table shows the temperatures y (in degrees Fahrenheit) in a city over a 24-hour period. Let x represent the time of day, where x = 0 corresponds to 6 a.m. These data can be approximated by the model y=0.026x31.03x2+10.2x+34,0x24 Use a graphing utility to create a scatter plot of the data. Then graph the model in the same viewing window. How well does the model fit the data? Use the graph to approximate the times when the temperature was increasing and decreasing. Use the graph to approximate the maximum and minimum temperatures during this 24-hour period. Could this model predict the temperatures in the city during the next 24-hour period? Why or why not?arrow_forwardMeasurement A billboard says that it is 12.5 miles or 20 kilometers to the next gas station. Use this information to find a mathematical model that relates miles x to kilometers y. Then use the model to find the numbers of kilometers in 5 miles and 25 miles.arrow_forward
- pH of Saliva The pH of saliva is normally in the range of 6.4 to 7.0. However, when a person is ill, the persons saliva becomes more acidic. a When Marco is sick, he tests the pH of his saliva and finds that it is 5.5. What is the hydrogen ion concentration of his saliva? b Will the hydrogen ion concentration in Marcos saliva increase or decrease as he gets better? c After Marco recovers, he tests the pH of his saliva, and it is 6.5. Was the saliva more acidic or less acidic when he was sick?arrow_forwardPower Consumption: The figure shows the power consumption in San Francisco for a day in September (P is measured in megawatts; t is hours stating at midnight). (a) What was the power consumption at 6:00 A.M? At 6:00 P.m.? (b) When was the power consumption the lowest? (c) Find the net change in the power consumption from 9:00 A.M. to 7:00 P.M/arrow_forwardStopping distance, The stopping distance of an automobile is the distance travelled during the driver’s reaction time plus the distance travelled after the driver applies the brakes. In an experiment, researchers measured these distances (in feet) when the automobile was traveling at a speed of x. miles per hour on dry, level pavement, as shown in the bar graph. The distance travelled during the reaction time R was R=1.1x and the braking distance B was B=0.0475x20.001x+0.23. (a) Determine the polynomial that represents the total stopping distance T. (b) Use the result of part (a) to estimate the total stopping distance when x=30,x=40, andx=55 miles per hour. (c) Use the bar graph to make a statement about the total stopping distance required forincreasing speeds.arrow_forward
- Speed Skating Two speed skaters, A and B, are racing in a 500-m event. The graph shows the distance they have traveled as a function of the time from the start of the race. aWho won the race? bFind the average speed during the first 10 s for each skater. cFind the average speed during the last 15 s for each skater.arrow_forwardDecomposing Functions To join a book club, you pay an initial fee and then a fixed price each month for a book. The total cost in dollars of joining the club and buying n books is given by C=30+17n. What is the initial fee? What is the cost of each book after you are a club member?arrow_forwardBaking a Potato: A potato is placed in a preheated oven to bake. Its temperature P=P(t) is given by P=400325et/50, Where P is measured in degrees Fahrenheit and t is the time in minutes since the potato was placed in the oven. a. Make a graph of P versus t.Suggestion: in choosing your graphing window, it is reasonable to look at the potato over no more than a 2-hour period. After that, it will surely be burned to a crisp. You may wish to look at a table of values to select a vertical span. b. What was the initial temperature of the potato? c. Did the potatos temperature rise more during the first 30 minutes or second 30 minutes of baking? What was the average rate of change per minute during the first 30 minutes? What was the average rate of change per minute during the second 30 minutes. d. Is this graph concave up or concave down? Explain what that tells you about how the potato heats up, and relate this to part c.. e. The potato will be done when it reaches a temperature of 270 degrees. Approximate the time when the potato will be done. f. What is the temperature of the oven? Explain how you got your answer. Hint: if the potato were left in the oven for a long time, its temperature would match that of the oven.arrow_forward
 Algebra and Trigonometry (MindTap Course List)AlgebraISBN:9781305071742Author:James Stewart, Lothar Redlin, Saleem WatsonPublisher:Cengage Learning
 College AlgebraAlgebraISBN:9781305115545Author:James Stewart, Lothar Redlin, Saleem WatsonPublisher:Cengage Learning
 Trigonometry (MindTap Course List)TrigonometryISBN:9781337278461Author:Ron LarsonPublisher:Cengage Learning
 Glencoe Algebra 1, Student Edition, 9780079039897...AlgebraISBN:9780079039897Author:CarterPublisher:McGraw Hill
 Algebra & Trigonometry with Analytic GeometryAlgebraISBN:9781133382119Author:SwokowskiPublisher:Cengage