
Concept explainers
Videos
To conduct: a suitable hypothesis and give the conclusion on the basis of given information.
Explanation of Solution
Given:
| Trait | Observed counts |
| Attached-non-curling | 10 |
| Attached-curling | 22 |
| Free-non-curling | 31 |
| Free curling | 59 |
Formula used:
Calculation:
State the null and alternative hypothesis
Traits is 1:3:3:9 this means that from 122 units, the expected number of these with
attached and non-curling trait is
Attached curling is
In this similar way estimated all
| Trait | Expected counts |
| Attached-non-curling | 7.625 |
| Attached-curling | 22.875 |
| Free-non-curling | 22.875 |
| Free curling | 68.625 |
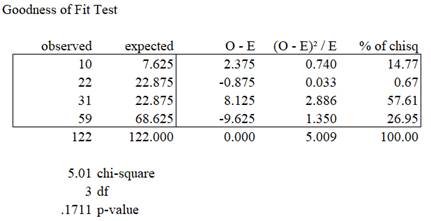
From the above output P-value is 0.1711 which is high and therefore not reject the null hypothesis which means that the observed traits are in the accordance with the genetic theory.
Want to see more full solutions like this?
Chapter PVII Solutions
Stats: Modeling the World Nasta Edition Grades 9-12
Additional Math Textbook Solutions
STATS:DATA+MODELS-W/DVD
Elementary Statistics: Picturing the World (6th Edition)
Basic Business Statistics, Student Value Edition
Fundamentals of Statistics (5th Edition)
Intro Stats, Books a la Carte Edition (5th Edition)


 MATLAB: An Introduction with ApplicationsStatisticsISBN:9781119256830Author:Amos GilatPublisher:John Wiley & Sons Inc
 Probability and Statistics for Engineering and th...StatisticsISBN:9781305251809Author:Jay L. DevorePublisher:Cengage Learning
 Statistics for The Behavioral Sciences (MindTap C...StatisticsISBN:9781305504912Author:Frederick J Gravetter, Larry B. WallnauPublisher:Cengage Learning
 Elementary Statistics: Picturing the World (7th E...StatisticsISBN:9780134683416Author:Ron Larson, Betsy FarberPublisher:PEARSON
 The Basic Practice of StatisticsStatisticsISBN:9781319042578Author:David S. Moore, William I. Notz, Michael A. FlignerPublisher:W. H. Freeman
 Introduction to the Practice of StatisticsStatisticsISBN:9781319013387Author:David S. Moore, George P. McCabe, Bruce A. CraigPublisher:W. H. Freeman