Stats
Stats
5th Edition
ISBN: 9780135163825
Author: De Veaux, Richard D., Velleman, Paul F., BOCK, David E.
Publisher: Pearson,
bartleby

Concept explainers

bartleby

Videos

Question
Book Icon
Chapter R, Problem 1.1RE

a.

To determine

Construct appropriate graph for the data.

a.

Expert Solution
Check Mark

Answer to Problem 1.1RE

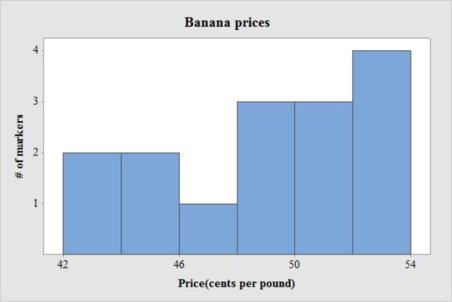
The appropriate graph for the data is given below:

Stats, Chapter R, Problem 1.1RE , additional homework tip  1

Explanation of Solution

Given info:

The data represents the sample of 15 bananas price surveyed by the U.S Department of agriculture.

Calculation:

The Histogram using MINITAB software is obtained below.

Software procedure:

Step by step procedure to draw the frequency histogram chart by using MINITAB software.

  • Choose Graph > Histogram.
  • Choose Simple, and then click OK.
  • In Graph variables, enter the corresponding column of data.
  • To modify the interval settings, double click on the horizontal axis of the graph. Then, select Labels > Specified. In this box, enter the values for the cut points of the bin intervals (42, 46, 50, 54)
  • In scale on y-axis, make click on frequency.
  • Click on ok.

Skew ness:

The data is said to be skewed if there is lack of symmetry and values fall on one side that is, either left or right of the distribution.

Left skewed:

If the tail on the distribution is elongated towards the left then it is a left skewed distribution. It is also called negatively skewed.

The mean is less than the median when the distribution of the data is left skewed. That is, Mean<Median<Mode.

In this case, the given data approximately follows left skewed distribution.

b.

To determine

Determine the appropriate summary statistics for the given data.

b.

Expert Solution
Check Mark

Answer to Problem 1.1RE

Median and IQR is the appropriate summary statistics for the given data.

Explanation of Solution

Calculation:

The summary statistics for the given data is obtained below.

Software procedure:

Step-by-step procedure to obtain summary statistics is given below.

  • Choose Stat > Basic Statistics > Display Descriptive Statistics.
  • In Variables, enter the columns Bananas
  • Choose Statistics and select the median and IQR.
  • Click OK.

Output obtained from the MINITAB is given below:

Stats, Chapter R, Problem 1.1RE , additional homework tip  2

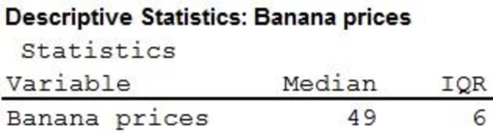
From the output, the median is 49 cents per pound, and the interquartile range is 6 cents per pound.

Relationship between mean and median:

  • The value of mean is equal to the median when the distribution of the data is symmetric. Mean=Median=Mode.
  • The mean is greater than the median when the distribution of the data is right skewed. Mean>Median>Mode.
  • The mean is less than the median when the distribution of the data is left skewed. That is, Mean<Median<Mode.

From part a., the distribution of the data is left skewed. This indicates that median will be greater than the mean.

Inter quartile range:

In contrast to the range, which measures only differences between the extremes, the inter quartile range (also called mid spread) is the difference between the third quartile and the first quartile. Thus, it measures the variation in the middle 50 percent of the data, and, unlike the range, is not affected by extreme values. IQR=Q3Q1

Thus, for a skewed distribution median and IQR are the better summary statistics.

c.

To determine

Describe the distribution with few sentences.

c.

Expert Solution
Check Mark

Explanation of Solution

Justification:

Histogram:

The graphical representation of classes of the quantitative data in the horizontal axis and class frequency in the vertical axis displayed in terms of bar is termed as histogram of the data.

Based on the number of peaks, the modality is classified into three types namely unimodal, bi-modal and multimodal.

Unimodal: The number of peak is one.

Bi-modal: The number of peak is two.

Multi-modal: The number of peak is three or more than three.

Here, the histogram has only one peak and it is elongated to left side. Hence it is unimodal and approximately left skewed.

Moreover, the center of the distribution lies approximately about 50 cents and it also contains of lowest price near 42 cents per pound and the highest price near 53 cents per pound.

Want to see more full solutions like this?

Subscribe now to access step-by-step solutions to millions of textbook problems written by subject matter experts!

Chapter R Solutions

Stats

Ch. R - Prob. 1.11RECh. R - R1.12. e-Books A study by the Pew Internet &...Ch. R - Prob. 1.13RECh. R - R1.14. Accidents Progressive Insurance asked...Ch. R - Prob. 1.15RECh. R - R1.16. Hard water II The data set from England and...Ch. R - Prob. 1.17RECh. R - R1.18. Old Faithful It is a common belief that...Ch. R - R1.19. Old Faithful? Does the duration of an...Ch. R - R1.20. Teen drivers 2013 The National Highway...Ch. R - Prob. 1.21RECh. R - Women’s Short Track 2018 The times of skaters in...Ch. R - Prob. 1.23RECh. R - R1.24. Sluggers Babe Ruth was the first great...Ch. R - Prob. 1.25RECh. R - R1.26. Music and memory Is it a good idea to...Ch. R - Prob. 1.27RECh. R - R1.28. Birth order Is your birth order related to...Ch. R - Prob. 1.29RECh. R - R1.30. Birth order revisited Consider again the...Ch. R - Prob. 1.31RECh. R - R1.32. Engines, again Horsepower is another...Ch. R - R1.33. Age and party 2011 The Pew Research Center...Ch. R - R1.34. Pay According to the Bureau of Labor...Ch. R - Prob. 1.35RECh. R - R1.36. Bike safety 2015 The Bicycle Helmet Safety...Ch. R - Prob. 1.37RECh. R - Prob. 1.38RECh. R - Prob. 1.41RECh. R - Prob. 1.42RECh. R - R1.43. Student survey investigation The Student...Ch. R - Prob. 1.44RECh. R - Prob. 2.1RECh. R - Prob. 2.2RECh. R - Prob. 2.3RECh. R - Prob. 2.4RECh. R - Prob. 2.5RECh. R - Prob. 2.6RECh. R - Prob. 2.7RECh. R - Prob. 2.8RECh. R - Prob. 2.9RECh. R - Prob. 2.10RECh. R - Prob. 2.11RECh. R - Prob. 2.12RECh. R - Prob. 2.13RECh. R - Prob. 2.14RECh. R - R2.15. Cars, correlations What factor most...Ch. R - R2.16. Cars, associations Look again at the...Ch. R - Prob. 2.17RECh. R - Prob. 2.18RECh. R - Prob. 2.19RECh. R - Prob. 2.20RECh. R - Prob. 2.21RECh. R - Prob. 2.22RECh. R - Prob. 2.23RECh. R - Prob. 2.24RECh. R - Prob. 2.25RECh. R - Prob. 2.26RECh. R - Prob. 2.27RECh. R - Prob. 2.28RECh. R - Prob. 2.29RECh. R - Prob. 2.30RECh. R - Prob. 2.31RECh. R - Prob. 2.32RECh. R - Prob. 2.33RECh. R - Prob. 2.34RECh. R - Prob. 2.35RECh. R - Prob. 2.36RECh. R - Prob. 2.37RECh. R - Prob. 2.38RECh. R - Prob. 2.39RECh. R - Prob. 2.40RECh. R - Prob. 2.41RECh. R - Prob. 2.42RECh. R - Prob. 2.43RECh. R - Prob. 2.44RECh. R - Prob. 2.45RECh. R - Prob. 2.46RECh. R - Prob. 2.47RECh. R - Prob. 2.48RECh. R - Prob. 2.49RECh. R - Prob. 2.50RECh. R - Prob. 2.51RECh. R - Prob. 2.52RECh. R - Prob. 3.1RECh. R - Prob. 3.2RECh. R - Prob. 3.3RECh. R - Prob. 3.4RECh. R - Prob. 3.5RECh. R - Prob. 3.6RECh. R - Prob. 3.7RECh. R - Prob. 3.8RECh. R - Prob. 3.9RECh. R - R3.1–R3.18. What design? Analyze the design of...Ch. R - Prob. 3.11RECh. R - Prob. 3.12RECh. R - Prob. 3.13RECh. R - Prob. 3.14RECh. R - Prob. 3.15RECh. R - Prob. 3.16RECh. R - R3.1–R3.18. What design? Analyze the design of...Ch. R - R3.1–R3.18. What design? Analyze the design of...Ch. R - Prob. 3.19RECh. R - Prob. 3.20RECh. R - R3.21. Alternate day fasting A paper published in...Ch. R - Prob. 3.22RECh. R - Prob. 3.23RECh. R - R3.24. Tips, take 2 In another experiment to see...Ch. R - Prob. 3.25RECh. R - Prob. 3.26RECh. R - Prob. 3.27RECh. R - R3.29. Homecoming A college statistics class...Ch. R - Prob. 3.29RECh. R - R3.31. Smoking and Alzheimer’s Medical studies...Ch. R - R3.32. Antacids A researcher wants to compare the...Ch. R - Prob. 3.32RECh. R - Prob. 3.33RECh. R - Prob. 3.34RECh. R - Prob. 3.35RECh. R - Prob. 3.36RECh. R - Prob. 3.37RECh. R - Prob. 3.38RECh. R - R3.39. Acupuncture Research reported in 2008...Ch. R - R3.40. Fuel efficiency Wayne Collier designed an...Ch. R - Prob. 3.41RECh. R - R3.42. Internet speed Carsten, Matt, and Rainer...Ch. R - Prob. 4.1RECh. R - Prob. 4.2RECh. R - Prob. 4.3RECh. R - Bipolar Psychiatrists estimate that about 1 in 100...Ch. R - A game To play a game, you must pay $5 for each...Ch. R - Prob. 4.6RECh. R - Prob. 4.7RECh. R - Prob. 4.8RECh. R - Prob. 4.9RECh. R - Prob. 4.10RECh. R - Prob. 4.11RECh. R - Prob. 4.12RECh. R - Prob. 4.13RECh. R - Prob. 4.14RECh. R - Prob. 4.15RECh. R - R4.17. Stocks Since the stock market began in...Ch. R - Multiple choice A multiple choice test has 50...Ch. R - Prob. 4.18RECh. R - Prob. 4.19RECh. R - Prob. 4.20RECh. R - Prob. 4.21RECh. R - Prob. 4.22RECh. R - Prob. 4.23RECh. R - Prob. 4.24RECh. R - Prob. 4.25RECh. R - Meals A college student on a seven-day meal plan...Ch. R - Prob. 4.27RECh. R - Picking melons Two stores sell watermelons. At the...Ch. R - Prob. 4.29RECh. R - Prob. 4.30RECh. R - Prob. 4.31RECh. R - Prob. 4.32RECh. R - Prob. 4.33RECh. R - Prob. 4.34RECh. R - Prob. 4.35RECh. R - Prob. 4.36RECh. R - Prob. 4.37RECh. R - Prob. 4.38RECh. R - Prob. 4.39RECh. R - Prob. 4.40RECh. R - Prob. 4.41RECh. R - Prob. 4.42RECh. R - Prob. 4.43RECh. R - Prob. 4.44RECh. R - Prob. 5.1RECh. R - Prob. 5.2RECh. R - Prob. 5.3RECh. R - R4.10. Hamsters How large are hamster litters?...Ch. R - Prob. 5.5RECh. R - R4.13. Fake news In a survey of 1002 U.S. adults...Ch. R - Prob. 5.7RECh. R - Prob. 5.8RECh. R - Prob. 5.9RECh. R - Prob. 5.10RECh. R - Prob. 5.11RECh. R - Prob. 5.12RECh. R - Prob. 5.13RECh. R - Prob. 5.14RECh. R - Prob. 5.15RECh. R - R4.27. Language Neurological research has shown...Ch. R - Prob. 5.17RECh. R - Prob. 5.18RECh. R - Prob. 5.19RECh. R - Prob. 5.20RECh. R - Prob. 5.21RECh. R - Prob. 5.22RECh. R - Prob. 5.23RECh. R - Prob. 5.24RECh. R - Prob. 5.25RECh. R - Prob. 5.26RECh. R - Prob. 5.27RECh. R - Prob. 5.28RECh. R - Prob. 5.29RECh. R - Prob. 5.30RECh. R - Prob. 5.31RECh. R - Prob. 5.32RECh. R - Prob. 5.33RECh. R - Prob. 5.34RECh. R - Prob. 5.35RECh. R - Prob. 5.36RECh. R - Prob. 5.37RECh. R - Prob. 5.38RECh. R - Prob. 5.39RECh. R - Prob. 5.40RECh. R - Prob. 6.1RECh. R - Prob. 6.2RECh. R - Prob. 6.3RECh. R - Prob. 6.4RECh. R - Prob. 6.5RECh. R - Prob. 6.6RECh. R - R5.7. Eclampsia deaths Refer again to the research...Ch. R - Prob. 6.8RECh. R - Prob. 6.9RECh. R - Prob. 6.10RECh. R - Prob. 6.11RECh. R - Prob. 6.12RECh. R - Prob. 6.13RECh. R - Prob. 6.14RECh. R - Prob. 6.15RECh. R - Prob. 6.17RECh. R - Prob. 6.18RECh. R - Prob. 6.19RECh. R - Prob. 6.20RECh. R - Prob. 6.21RECh. R - Prob. 6.23RECh. R - Prob. 6.25RECh. R - Prob. 6.28RECh. R - Prob. 6.29RECh. R - Prob. 6.30RECh. R - Prob. 6.31RECh. R - Prob. 6.32RECh. R - Prob. 6.33RECh. R - Prob. 6.34RECh. R - Prob. 6.35RECh. R - Prob. 6.36RECh. R - Prob. 6.37RECh. R - R5.38. Age and party 2016 The Pew Research Center...Ch. R - Prob. 6.39RECh. R - Prob. 6.40RECh. R - Prob. 6.41RECh. R - Prob. 6.42RECh. R - Prob. 6.43RECh. R - Prob. 6.44RECh. R - Prob. 6.45RECh. R - Prob. 6.46RECh. R - Prob. 6.47RECh. R - Prob. 6.48RECh. R - Prob. 6.49RECh. R - R5.50. Cramming Students in two basic Spanish...Ch. R - Prob. 6.51RECh. R - Prob. 6.52RECh. R - Prob. 7.3RECh. R - Prob. 7.4RECh. R - Prob. 7.5RECh. R - Prob. 7.6RECh. R - Prob. 7.7RECh. R - Prob. 7.8RECh. R - Prob. 7.9RECh. R - Prob. 7.10RECh. R - Prob. 7.11RECh. R - Nuclear plants Here are data on 32 light water...Ch. R - Prob. 7.13RECh. R - Prob. 7.15RECh. R - Prob. 7.16RECh. R - Prob. 7.17RECh. R - Prob. 7.18RECh. R - Prob. 7.19RECh. R - Prob. 7.20RECh. R - Prob. 7.21RECh. R - Prob. 7.23RECh. R - Prob. 7.24RECh. R - Prob. 7.25RECh. R - Prob. 7.27RECh. R - Prob. 7.28RECh. R - Prob. 7.29RE
Knowledge Booster
Background pattern image
Statistics
Learn more about
Need a deep-dive on the concept behind this application? Look no further. Learn more about this topic, statistics and related others by exploring similar questions and additional content below.
Recommended textbooks for you
Text book image
MATLAB: An Introduction with Applications
Statistics
ISBN:9781119256830
Author:Amos Gilat
Publisher:John Wiley & Sons Inc
Text book image
Probability and Statistics for Engineering and th...
Statistics
ISBN:9781305251809
Author:Jay L. Devore
Publisher:Cengage Learning
Text book image
Statistics for The Behavioral Sciences (MindTap C...
Statistics
ISBN:9781305504912
Author:Frederick J Gravetter, Larry B. Wallnau
Publisher:Cengage Learning
Text book image
Elementary Statistics: Picturing the World (7th E...
Statistics
ISBN:9780134683416
Author:Ron Larson, Betsy Farber
Publisher:PEARSON
Text book image
The Basic Practice of Statistics
Statistics
ISBN:9781319042578
Author:David S. Moore, William I. Notz, Michael A. Fligner
Publisher:W. H. Freeman
Text book image
Introduction to the Practice of Statistics
Statistics
ISBN:9781319013387
Author:David S. Moore, George P. McCabe, Bruce A. Craig
Publisher:W. H. Freeman
Correlation Vs Regression: Difference Between them with definition & Comparison Chart; Author: Key Differences;https://www.youtube.com/watch?v=Ou2QGSJVd0U;License: Standard YouTube License, CC-BY
Correlation and Regression: Concepts with Illustrative examples; Author: LEARN & APPLY : Lean and Six Sigma;https://www.youtube.com/watch?v=xTpHD5WLuoA;License: Standard YouTube License, CC-BY