What are R and K Selection?
R and K selection are concepts in ecology used to describe traits in the fluctuation of a population or population dynamics. For example, they describe the life-association traits between parent and offspring, such as quantity or number of young ones born at a time, quality of parental care, the age to maturity, and reproductive effort.
Characteristics of R and K Selection
R and K selections are reproductive strategies that organisms adapt for the growth of their populations.
Organisms that use r-selection or r-strategists are often found in unstable or unpredictable environments. Hence, their ability to survive and grow their population is largely determined by producing a higher number of young ones or exponential growth. These organisms make little to no investment in caring for their offspring. The offspring are typically weak and are often exposed to predation or harsh environmental factors. The strategy is to flood the habitat with progeny to ensure the survival of few organisms, despite predation or mortality. These organisms are smaller in size, have a shorter period to maturity, shorter lifespan, and waste a lot of energy. For example, marine invertebrates such as jellyfish, salmon, insects, mice, bacteria are r-selected organisms.
Organisms that use k-selection or k-strategists occupy stable or more predictable environments. They are larger, have a longer period to maturity and lifespan, and are more energy-efficient. These organisms produce a fewer number of young ones. They grow and mature slowly, and their young ones are stronger and have a greater probability of surviving. The parents nurture and take care of their young ones. For example, elephants, humans, bald eagles, whales are k-selected organisms.
History of R and K Selection Theory
The r/K selection theory was originally introduced in ecology by MacArthur and Wilson in 1967. The concept was initially described as follows: organisms that had r-selection had a high population growth in uncrowded habitats, and K-selection was the ability of organisms to compete and grow in crowded habitats. The more recent and expanded summary of the concept includes more traits associated with the organism's life history.
Features of R-selected organisms
- Mature early.
- Produce a large number of young ones.
- Exhibit semelparity or have a single reproductive episode in their lifetime before death.
- Parents do not take care of progeny.
- More reproductive effort and often waste energy.
Features of K-selected organisms
- Mature later and have delayed reproduction.
- Produce a lesser number of young ones.
- Exhibit iteroparity or have multiple reproductive cycles in their lifetime.
- Parents invest a lot of time and effort to take care of young ones.
- Smaller reproductive effort and are energy efficient.
Population Dynamics
Population dynamics is the study of changes in the size of a population in a given habitat. Several models have been used to represent and understand population dynamics. The population growth rate over time can be represented as:
N is the number of individuals, at time T, and a per capita increase rate of r. If it is assumed that there is no migration of individuals from the study set, then r is just a function of birth (B) and death (D) rates.
If the R-value remains constant and positive, regardless of the population density, it results in exponential growth. rmax is the maximum per capita rate. The following equation represents the maximum population growth rate of a given species or the biotic potential:
If the R-value decreases when the population nears the maximum capacity limit of the habitat, it results in logistic growth.
How is the Growth of a Population Regulated?
Population growth is regulated by nature in many different ways. These may be broadly grouped into density-dependent and density-independent. Density-dependent factors include overcrowding, depletion of nutrition, accumulation of wastes, predation, intra- and inter-species competition. Density-independent factors may be abiotic such as physical or chemical components, climate (harsh winters or summers, low rainfall), natural disasters (earthquake, volcano, forest fires).
Exponential Growth Curve
Under ideal conditions, populations of most species could hypothetically grow exponentially. If a population is growing exponentially, then the growth curve would be a J-curve. For example, bacteria such as Escherichia coli have a doubling time of 20 minutes. So, an initial inoculum of about 1000 bacteria could double to 2000 bacteria in 20 minutes. In 40 min, the population could reach 4000 bacteria, and in an hour, about 8000 bacteria. In 24 hours, the population could reach over 48 billion. Thus, the R-value is the slope of the line during exponential growth.

Logistic Growth Curve
However, in nature, most populations are not always living under ideal conditions. There are many growth limiting factors such as overcrowding, shortage of food, or toxic effects of waste accumulation. Due to this, density-dependent effects start to affect the growth of the population.
Besides, habitats are not occupied by a single type of population. Instead, several different species or sub-species compete for the same resources. Factors such as inter-and intra-species competition and diseases cause the population growth to level off. This pattern of growth is called logistic growth. The logistic growth curve would be an S-shaped curve.
The level at which the population levels' logistic growth is known as the carrying capacity or the K-value. The carrying capacity is the largest size of a population that can be supported without damaging the environment.
Mathematically, logistic growth of a population of N individuals with a carrying capacity of K and maximum per capita rate of increase of rmax at time T can be expressed as:

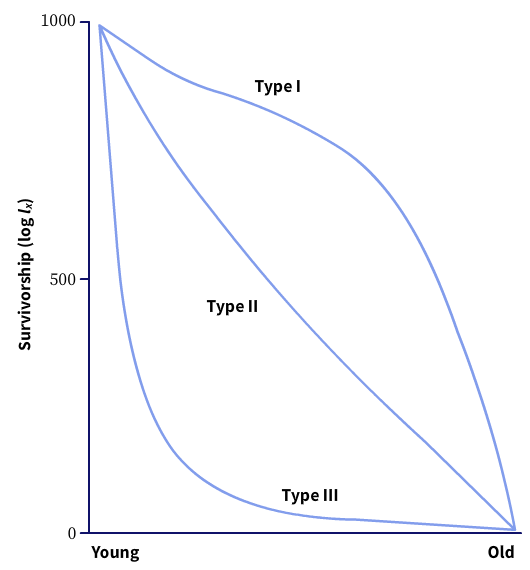
Survivorship Curve
A survivorship curve depicts the number of survivors of a particular species based on their age or life stage. There are three types of curves, type I, II, and III. Type I curve represents populations that have low mortality until they reach the end of their life span. This curve is seen in K-selected organisms such as large mammals like humans or elephants. Type III curve depicts populations that have a higher mortality rate in the early stages of life. It is generally followed by r-selected organisms such as small mammals, fishes, and invertebrates. There are some organisms for which the survivorship rate does not fit either the r or K-strategies. Their chances of survival remain constant throughout their lifetime. Examples, birds, squirrels, mice, rabbits. Ecologists have been unable to validate this survivorship theory with empirical evidence in nature. Some organisms may tend to lean more towards type I or type III curves because several factors other than r/K selection control the survivorship of a species. This theory is considered obsolete in modern times.
Continuous Spectrum and Alteration in R/K Selection
Selective pressures of the environment drive the evolution of organisms into either r or K-selections. Although organisms may primarily adopt one of two options, many organisms seem to adopt a combination. In some cases, a clear dichotomy exhibited at the beginning of the life span may be expressed as a continuous spectrum. For example, trees with a long lifespan and hardy have greater survivability than the K-selected organisms. But they produce thousands of offsprings and disperse them widely, similar to r-selected organisms.
Sea turtles are r-selected organisms that reproduce in large numbers and higher mortality for young adults. Still, they also have a long lifespan once they reach adulthood and escape predators.
Depending upon the environmental conditions, some organisms could alternate between the two growth strategies. For example, bacterial biofilms grow slowly over days or weeks, have a slower metabolic rate, and exist for a longer time. Biofilms of bacteria have an extracellular matrix that can protect them from toxic substances, chemicals, or harsh environmental conditions. These properties of the biofilm increase survivability. Biofilms may be composed of multiple species of bacteria, which are energy efficient. The waste products produced by one species could be used as an energy source by another. Thus, biofilms can act as K-strategists. When the growth conditions are suitable, bacteria can switch to exponential growth like r-strategists.
Summary of Characteristics of R and K Selection
| r-strategists | K-strategists | |
| Selection | Higher rate or increase or r-value | Competitive organisms that are in crowded conditions near carrying capacity |
| Environment | Variable and unpredictable | Stable and predictable |
| Characteristics | A higher number of offspring | Fewer offspring |
| Small body size | Large body size | |
| Weak | Strong | |
| Energy inefficient | Energy efficient | |
| Early reproductive age | Later reproductive age | |
| Lower intelligence | Higher intelligence | |
| Mature fast | Mature slowly | |
| Little parental care | Higher parental care | |
| Survivability | Lower survivability | Higher survivability |
| Short lifespan | Long lifespan | |
| Typically, the type III survivorship curve | Type I or II survivorship curves | |
| Mortality | Non-directed density-dependent | Directed density-dependent |
Context and Applications
- The r/K selected life history concepts have been extensively used to understand population growth dynamics. However, modern theories of life history have either discarded the original definitions or modified them. Some key aspects that the older theories did not account for were the aging and the associated decline in populations and migration or changes in habitats. The new and more accepted versions of the theories include demographic-based models of life-history evolution and age-related mortality.
- Life history theory is useful in understanding which species is on the verge of extinction. Although energy-efficient and having higher survivability, K-strategists are often at a higher risk of extinction because of their size, fewer offspring, late maturation, and reproduction. The K-strategists also have a higher risk of inbreeding and loss of diversity. For example, compare the risk of extinction of an r-selected mammal (rodents, rabbits) and a k-selected mammal (elephants, rhinoceros, blue whales, sperm whales, or large trees like sequoia).
- Ecologists could use these theories to understand how an ecosystem can recover following an ecological event like a forest fire or a volcanic eruption. These concepts can also be applied to understand changes to microenvironments or landscapes and predict endemic fluctuations in biodiversity.
- Some scientists have explained the human inflammatory immune response using the r/K selection theory. An infection can be considered as an imbalance in the equilibrium between the pathogens and the natural microbiota. The infectious pathogens grow fast and behave like r-strategists. However, the natural microbes can form a biofilm in the body, are more stable, and do not replicate rapidly, mimicking K-strategists.
This topic is significant in the professional exams for both undergraduate and graduate courses, especially for;
- Bachelors in Sciences (Botany)
- Masters in Sciences (Botany)
- Masters in Technology (Biotechnology)
Want more help with your biology homework?
*Response times may vary by subject and question complexity. Median response time is 34 minutes for paid subscribers and may be longer for promotional offers.
R and K Selection Homework Questions from Fellow Students
Browse our recently answered R and K Selection homework questions.