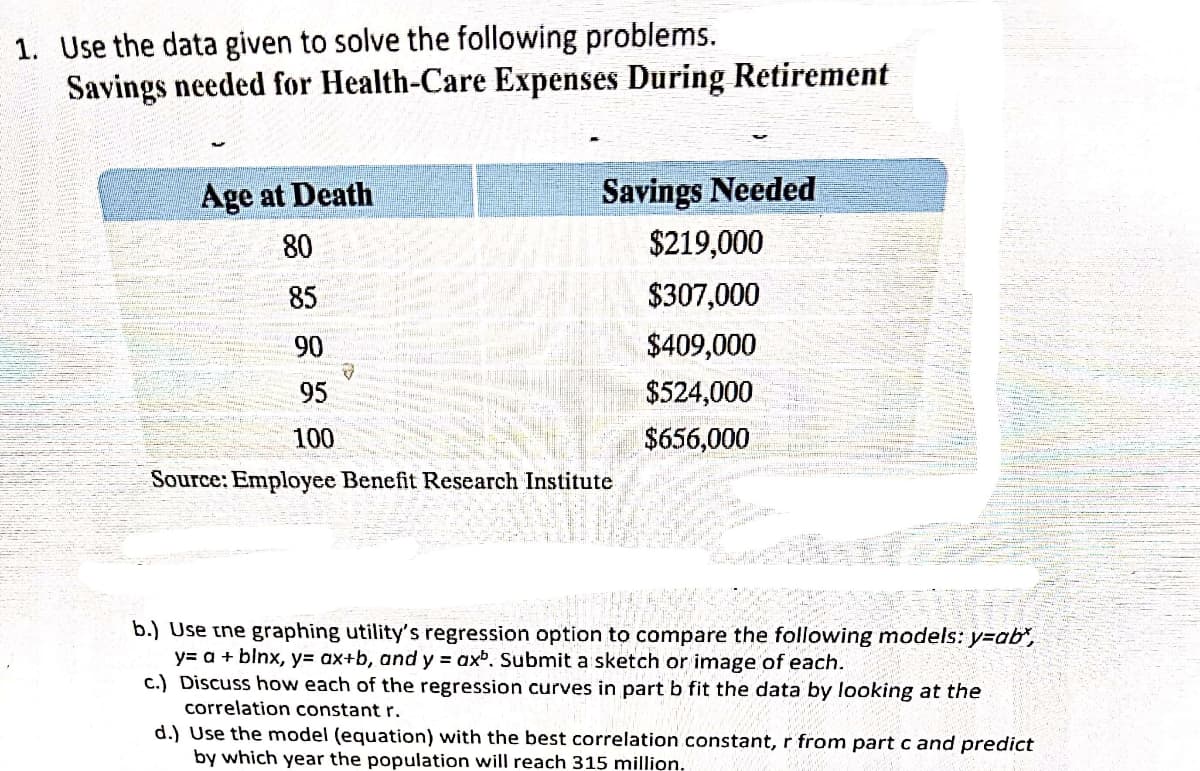
1. Use the data given to solve the following problems. Savings needed for Health-Care Expenses During Retirement Age at Death Savings Needed 80 $219,000 85 $307,000 90 $409,000 95 $524,000 100 $656,000 Source: Employee Benefit Research Institute


Q: The table below comes from EPI’s Family Budget Calculator which demonstrates the income a family…
A:
Q: Food Housing $400 $400 Insurance $80 Transportation $160 Education $80 Personal $80 Savings $160…
A: Total income is calculated as: =400+400+80+80+80+80+160+160+160 =1600
Q: The expenditure pattern of certain households in the Greater Accra region of Ghana is presented in…
A: We have the computations as below: Annual Expenditure Class mark (xi) Households (fi)…
Q: The following national income data are available for a country. All data are in billion dollars.…
A: Hi, Since you have asked multiple questions, we will solve the first question for you. If want any…
Q: For the year data given in the chart find a power function that is used to model the Lorenz…
A: A power function is of the form,y = axbWe can take log to the natural base “e” on the both the sides…
Q: 11. Please complete the table: Static Favorable OR Budget Actual Variance Unfavorab le. Units…
A: The answers to the blanks in the table above are as follows :
Q: 5. An enquiry into budgets of the middle class families in a city gave the following information :…
A:
Q: The table shows the estimated yearly costs to attend Texas A&M University. What is the estimated…
A: We have to find the estimated total cost to attend the first year.
Q: Year 1915 1920 1925 1930 1935 1940 1945 1950 1955 Rate 3.1 2.2 5.3 7.5 8.5 7.4 10.3 22.1 17.6…
A: “Since you have asked multiple questions, we will solve the first question for you. If you want any…
Q: Suppose these data show the number of gallons of gasoline sold by a gasoline distributor in…
A: a) The four-week moving average forecast corresponding to the ith week can be calculated by taking…
Q: The following information on maintenance and repair costs and revenues for the last two years is…
A: The data set is: Month Maintenance and Repair Cost ($000) Revenues ($000) July 2.31 59.00…
Q: 5. Estimate the production for the years 2008 and 2010 with the help of the following table : Year…
A: The following data is given: Year Production 2005 200 2006 220 2007 260 2009 350 2011…
Q: Write the estimated regression equation using the least squares estimates for b0b0 and b1b1
A: It is given that Intercept b0 = 477.24183007 And coefficient of month b1 = 26.73477812
Q: 1. Create a Table of Expenses of your family in a week. ( 2. List the number of expenses for each…
A: Lets create a table of our expenses in a month Let the monthly income for Mr. X is 14400 rupees
Q: TABLE 1.5 The amount of money expended in fiscal year 2009 by the U.S. Department of Defense in…
A:
Q: Given the following data: Year |Weekly take-home Consumer pay (wages price index 2007 109.5 112.8…
A:
Q: This question refer to the following data: Sentence Year. 13 10 8 6 4 7 14 9. 7 What is the mode?…
A: Given data, 13,10,8,6,4,7,14,9,7 Mode=?
Q: The Deinell-Forging-Corporation manufactures four highly confidential products that it supplies to…
A:
Q: CHAPTER 6-General Health and Population Indicators The next three questions relate to the following…
A: 1) Infant Mortality Rate 2) Maternal Mortality Rate 3) Crude Mortality Rate due to Cancer 4)…
Q: The staff of controller of McCourt Company added the variable "pounds moved" to the ten-month data…
A: Note: Hey, since there are multiple subparts posted, we will answer first two subparts. If you want…
Q: From Table 3, what is the projected total change and the percent change from 2020 to 2040 for the…
A:
Q: City Index City Index Atlanta 100 | San Francisco 172 Boston | 146 Phoenix 122 Chicago 105 Miami 161…
A:
Q: Į Represent the following data by a suitable diagram : Family A (Income Items of Expenditure Food…
A: Given: Items of Expenditure Family A (Income) Family B (Income) Food 150 150 Clothing 125 60…
Q: 1. Using the data below which are the number of kilos of r contributed by one section in the…
A: Since you have posted a question with multiple sub-parts, we will solve first three sub-parts for…
Q: Use the population data in Table 1.8 to estimate the population for the year 2000. Com-pare the…
A: Let year be denoted by x and Population by y. Then, x y x-x y-y (x-x)(y-y) (x-x)2 (y-y)2 1880…
Q: Frample 1 Represent the following data diagrammatically. Cost price: 3.00 8.00 5.00 3.00 2.00…
A:
Q: Refer to Table 1.6. a. What is the average cost for the tablets? b. Compare the average cost of…
A: The mean value of a dataset is computed by dividing the sum of the observation by the total number…
Q: :4:18. Draw a pie diagram to represent the following data of proposed expenditure hy a State…
A:
Q: Cell phone subscribers Year Top U.S. law firms gross revenue (in million dolları (in thousands) 1989…
A: Let us consider the numbers of Cell phone subscribers (in thousands) to be X and the Top U.S. law…
Q: (c) Table 1 shows the daily income of fruit sellers. 100 120 120 110 200 180 170 160 145 120 Table…
A: Given data, 100 120 120 110 200 180 170 160 145 120 Arrange the data in the ascending order 100 110…
Q: Consider the following population table. 1970 1980 1990 2000 2010 2020 State A 11,110,485 11,427,509…
A: Population table is given.We find how much did the population of State C increase from 2000 to 2010.
Q: Provide the missing data in the following table for a distributor of martial arts products: (Round…
A: According to the problem, we have
Q: SHORT QUIZ I. Complete the following table using the data below. Area 1 50 3.5 1.20 48 36 4.8 83 75…
A:
Q: You may need to use the appropriate technology to answer this question. Do students with higher…
A: a) Use the given data to construct the scatter plot:
Q: 2. The demand for hand sanitizers is off the charts due to this corona virus outbreak. People are in…
A: X:- 12, 13, 14, 15, 17, 18, 21, 25 Y:- 1000, 1550, 1600, 1800, 1900, 2200, 2700, 3500…
Q: -9. For the following data prepare a suitable diagram showing Balance of Trade: Years Exports (In.…
A:
Q: Year Global plastic production (tonnes-year¬1) 46,000,000 64,000,000 72,000,000 86,000,000…
A: Given is the table for plastics production from year 1975 to 2014 We need to find the appropriate…
Q: Use the data given to solve the following problems. Savings needed for Health-Care Expenses During…
A:
Q: Present the following data of final consumption expenditure of family with the help of a…
A: Given : Items % of income spent Cloths 15 Food 60 Education 10 Electricity 5 Others 10
Q: 3. Examine the following data, showing the enrollment of a University for the past 5 years.…
A: Hint: Fit the linear regression of the form y= a+bx. estimate a and b as; b=∑xi-xyi-y∑xi-x2 a= y-b…
Q: (c) Table 1 shows the daily income of fruit sellers. 100 120 120 110 200 180 170 160 145 120 Table 1…
A:
Q: School Type Cost 30 Year ROI Annual ROI Private $222,700.00 $1,786,000.00 7.70% Private $176,400.00…
A: The regression equation is defined as, Y^=b0+b1X Now, the regression analysis is done in excel by…
Q: 2.1 Display Data 84. Table 2.63 contains the 2010 obesity rates in U.S. states and Washington, DC.…
A: Given : Alabama 32.2 Kentucky 31.3 North Dakota 27.2 Alaska 24.5 Louisiana 31.0 Ohio 29.2 Arizona…
Q: A company yearly sales data (in units) is given as follows: Year Month 2020 2021 January 327 411…
A: Given : A company yearly sales data is given.
Q: Example 42. Incomplete information obtained from a partially destroyed records on cost of living…
A:
Q: Table 1:Age specific population and number of deaths of country A, Country B and Country C Age…
A: CDR is a measure in the fall in the population which takes place as a result of death.The following…
Q: E2ording to Statistics Canada population projections, visible minorities could account for over of…
A: Given that According to Statistics Canada population projections visible minorities could account…
Q: 47. Given the following data : Weekly take-home pay (wages) Consumer price index Year 109.50 112.8…
A:
Q: Need a Net balance graph for the given data
A:


Trending now
This is a popular solution!

Step by step
Solved in 4 steps with 5 images

- Find the equation of the regression line for the following data set. x 1 2 3 y 0 3 4Olympic Pole Vault The graph in Figure 7 indicates that in recent years the winning Olympic men’s pole vault height has fallen below the value predicted by the regression line in Example 2. This might have occurred because when the pole vault was a new event there was much room for improvement in vaulters’ performances, whereas now even the best training can produce only incremental advances. Let’s see whether concentrating on more recent results gives a better predictor of future records. (a) Use the data in Table 2 (page 176) to complete the table of winning pole vault heights shown in the margin. (Note that we are using x=0 to correspond to the year 1972, where this restricted data set begins.) (b) Find the regression line for the data in part ‚(a). (c) Plot the data and the regression line on the same axes. Does the regression line seem to provide a good model for the data? (d) What does the regression line predict as the winning pole vault height for the 2012 Olympics? Compare this predicted value to the actual 2012 winning height of 5.97 m, as described on page 177. Has this new regression line provided a better prediction than the line in Example 2?Consider the following linear regression model that relates income per capita in thousand dollars of a country i (GDP P Ci), with its percentage of the population in the agricultural sector (P Ai): Model : GDP P Ci = β0 + β1P Ai + ui (a) Explain in words how to interpret parameters β0 and β1. What sign do you think these parameters might have? Explain. (b) Draw the (population) regression line associated with this model assuming that parameters β0 and β1 have the sign you have indicated in answering question (2a). Explain the meaning of this regression line.
- The director of marketing at Vanguard Corporation believes that sales of the company's Bright Side laundry detergent (S) are related to Vanguard's own advertising expenditure (A), as well as the combined advertising expenditures of its three biggest rival detergent (R). The marketing director collects 36 weekly observations on S, A and R to estimate the following multiple regression equation: S = a + bA + cR .where, S, A, and R are measured in dollars per week. Vanguard's marketing director is comfortable using parameter estimates that are statistically significant at the 10% level or better.DEPENDENT VARIABLE: S R-SQUARE F-RATIO P-VALUE ON FOBSERVATIONS: 36 0.2247 4.781 0.0150VARIABLE PARAMETER STANDARD T-RATIO P-VALUE ESTIMATE ERRORINTERCEPT 175086.0 63821.0 2.74 0.0098A 0.8550 0.3250…The following table shows the annual number of PhD graduates in a country in various fields. NaturalSciences Engineering SocialSciences Education 1990 70 10 60 30 1995 130 40 120 50 2000 330 130 280 140 2005 490 370 460 210 2010 590 550 830 520 2012 690 590 1,000 900 (a) With x = the number of social science doctorates and y = the number of education doctorates, use technology to obtain the regression equation. (Round coefficients to three significant digits.) y(x) = Graph the associated points and regression line. (b) What does the slope tell you about the relationship between the number of social science doctorates and the number of education doctorates? The slope tells us the increase in the number of education doctorates for each additional social science doctorate.The slope tells us the decrease in the number of education doctorates for each additional social science doctorate. The slope tells us the increase in the number…The director of marketing at Vanguard Corporation believes that sales of the company's Bright Side laundry detergent (S) are related to Vanguard's own advertising expenditure (A), as well as the combined advertising expenditures of its three biggest rival detergents (R). The marketing director collects 36 weekly observations on S, A, and R to estimate the following multiple regression equation: S = a + bA + cR where S, A, and R are measured in dollars per week. Vanguard's marketing director is comfortable using parameter estimates that are statistically significant at the 10 percent level or better. a. What sign does the marketing director expect a, b, and c to have? b. Interpret the coefficeints a, b, and c. The regression output from the computer is as follows: c. Does Vanguard's advertising expenditure have a statistically significant effect on the sales of Bright Side detergent? Explain, using the appropriate…
- The director of marketing at Vanguard Corporation believes that sales of the company’s Bright Side laundry detergent (S) are related to Vanguard’s own advertising expenditure (A), as well as the combined advertising expenditures of its three biggest rival detergents (R). The marketing director collects 36 weekly observations on S, A, and R to estimate the following multiple regression equation: S = a + bA + cR. where S, A, and R are measured in dollars per week. Vanguard’s marketing director is comfortable using parameter estimates that are statistically significant at the 10 percent level or better. What sign does the marketing director expect a, b, and c to have? Interpret the coefficients a, b, and c. The regression output from the computer is as follows: 3- Does Vanguard’s advertising expenditure have a statistically significant effect on the sales of Bright Side detergent? Explain, using the appropriate p-value. 4- Does advertising by its three largest rivals affect sales of…The director of marketing at Vanguard Corporation believes that sales of the company's Bright Side laundry detergent (S) are related to Vanguard's own advertising expenditure (A), as well as the combined advertising expenditures of its three biggest rival detergents (R). The marketing director collects 36 weekly observations on S, A, and R to estimate the following multiple regression equation: S = a + bA + cR where S, A, and R are measured in dollars per week. Vanguard's marketing director is comfortable using parameter estimates that are statistically significant at the 10 percent level or better. a. What sign does the marketing director expect a, b, and c to have? b. Interpret the coefficeints a, b, and c. The regression output from the computer is as follows: c. Does Vanguard's advertising expenditure have a statistically significant effect on the sales of Bright Side detergent? Explain, using the appropriate…The following table shows the annual number of PhD graduates in a country in various fields. NaturalSciences Engineering SocialSciences Education 1990 70 10 70 30 1995 130 40 110 50 2000 330 130 280 140 2005 490 370 460 210 2010 590 550 830 520 2012 690 590 1,000 900 (a) With x = the number of social science doctorates and y = the number of education doctorates, use technology to obtain the regression equation. (Round coefficients to three significant digits.) y(x) = Graph the associated points and regression line. (b) What does the slope tell you about the relationship between the number of social science doctorates and the number of education doctorates? The slope tells us the increase in the number of social science doctorates for each additional education doctorate.The slope tells us the increase in the number of education doctorates for each additional social science doctorate. The slope tells us the decrease in the number…
- The following table shows the annual number of PhD graduates in a country in various fields. NaturalSciences Engineering SocialSciences Education 1990 70 10 60 30 1995 130 40 100 50 2000 330 130 280 120 2005 490 370 460 210 2010 590 550 830 520 2012 690 590 1,000 900 (a) With x = the number of social science doctorates and y = the number of education doctorates, use technology to obtain the regression equation. (Round coefficients to three significant digits.) y(x) = What does the slope tell you about the relationship between the number of social science doctorates and the number of education doctorates? The slope tells us the increase in the number of education doctorates for each additional social science doctorate. The slope tells us the decrease in the number of social science doctorates for each additional education doctorate. The slope tells us the increase in the number of social science doctorates for each additional education doctorate.…The following table shows the annual number of PhD graduates in a country in various fields. NaturalSciences Engineering SocialSciences Education 1990 70 10 60 30 1995 130 40 100 50 2000 330 130 280 140 2005 490 370 460 210 2010 590 550 830 520 2012 690 590 1,000 900 (a) With x = the number of social science doctorates and y = the number of education doctorates, use technology to obtain the regression equation. (Round coefficients to three significant digits.) y(x) =The following table shows the annual number of PhD graduates in a country in various fields. NaturalSciences Engineering SocialSciences Education 1990 70 10 70 30 1995 130 40 110 40 2000 330 130 280 120 2005 490 370 460 210 2010 590 550 830 520 2012 690 590 1,000 900 (a) With x = the number of social science doctorates and y = the number of education doctorates, use technology to obtain the regression equation. (Round coefficients to three significant digits.) y(x) = (b) Use technology to obtain the coefficient of correlation r. (Round your answer to three decimal places.) r =

