22. What is the power of each of the following studies, using a t test for dependent means (based on the .05 significance level)? (a) (b) (C) (d) (e) (1) (g) Effect Size Small Medium Large Small Small Small Small N 50 50 50 10 40 100 100 Tails Two Two Two Two Two Two One
22. What is the power of each of the following studies, using a t test for dependent means (based on the .05 significance level)? (a) (b) (C) (d) (e) (1) (g) Effect Size Small Medium Large Small Small Small Small N 50 50 50 10 40 100 100 Tails Two Two Two Two Two Two One

MATLAB: An Introduction with Applications
6th Edition
ISBN:9781119256830
Author:Amos Gilat
Publisher:Amos Gilat
Chapter1: Starting With Matlab
Section: Chapter Questions
Problem 1P

Related questions
Question
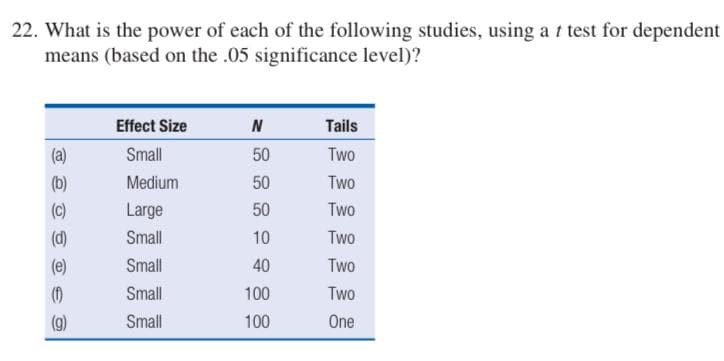
Transcribed Image Text:22. What is the power of each of the following studies, using a t test for dependent
means (based on the .05 significance level)?
(a)
(b)
(C)
(d)
(e)
(0)
(g)
Effect Size
Small
Medium
Large
Small
Small
Small
Small
N
50
50
50
10
40
100
100
Tails
Two
Two
Two
Two
Two
Two
One
Expert Solution
This question has been solved!
Explore an expertly crafted, step-by-step solution for a thorough understanding of key concepts.

This is a popular solution!

Trending now
This is a popular solution!

Step by step
Solved in 8 steps with 7 images

Recommended textbooks for you
MATLAB: An Introduction with Applications
Statistics
ISBN:
9781119256830
Author:
Amos Gilat
Publisher:
John Wiley & Sons Inc

Probability and Statistics for Engineering and th…
Statistics
ISBN:
9781305251809
Author:
Jay L. Devore
Publisher:
Cengage Learning

Statistics for The Behavioral Sciences (MindTap C…
Statistics
ISBN:
9781305504912
Author:
Frederick J Gravetter, Larry B. Wallnau
Publisher:
Cengage Learning
MATLAB: An Introduction with Applications
Statistics
ISBN:
9781119256830
Author:
Amos Gilat
Publisher:
John Wiley & Sons Inc
Probability and Statistics for Engineering and th…
Statistics
ISBN:
9781305251809
Author:
Jay L. Devore
Publisher:
Cengage Learning
Statistics for The Behavioral Sciences (MindTap C…
Statistics
ISBN:
9781305504912
Author:
Frederick J Gravetter, Larry B. Wallnau
Publisher:
Cengage Learning

Elementary Statistics: Picturing the World (7th E…
Statistics
ISBN:
9780134683416
Author:
Ron Larson, Betsy Farber
Publisher:
PEARSON

The Basic Practice of Statistics
Statistics
ISBN:
9781319042578
Author:
David S. Moore, William I. Notz, Michael A. Fligner
Publisher:
W. H. Freeman

Introduction to the Practice of Statistics
Statistics
ISBN:
9781319013387
Author:
David S. Moore, George P. McCabe, Bruce A. Craig
Publisher:
W. H. Freeman