36 6 5 79 6 7 8 56 the linear regression of the data? egers or decimals for any numbers in the ion. Round to the nearest tenth as needed.) 8- 6- 4- 2- 0 2 A 6 -∞o 8 X 10
36 6 5 79 6 7 8 56 the linear regression of the data? egers or decimals for any numbers in the ion. Round to the nearest tenth as needed.) 8- 6- 4- 2- 0 2 A 6 -∞o 8 X 10

Glencoe Algebra 1, Student Edition, 9780079039897, 0079039898, 2018
18th Edition
ISBN:9780079039897
Author:Carter
Publisher:Carter
Chapter4: Equations Of Linear Functions
Section4.6: Regression And Median-fit Lines
Problem 5PPS

Related questions
Question
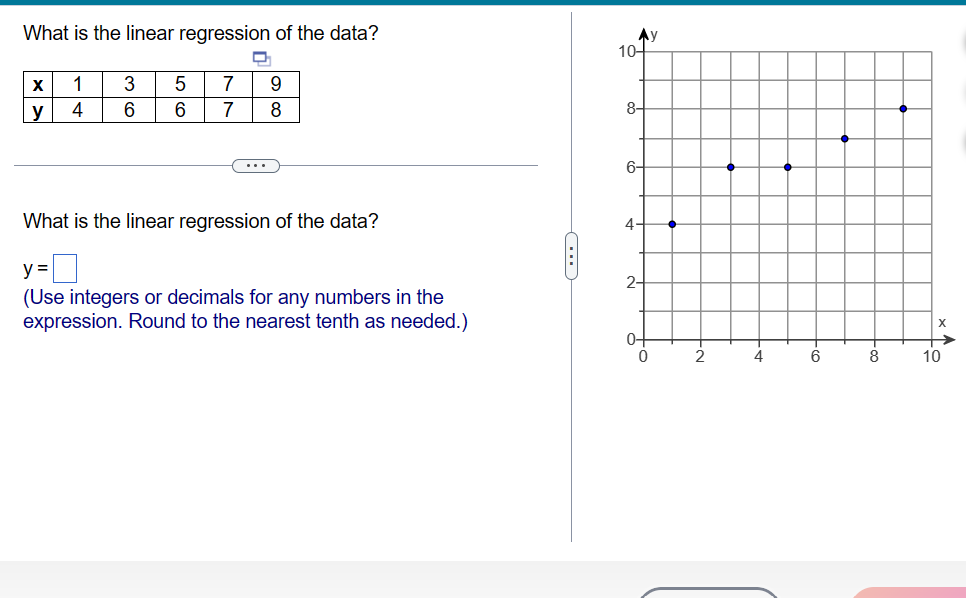
Transcribed Image Text:What is the linear regression of the data?
X
y
1
4
3
6
5
6
U
7
9
7 8
What is the linear regression of the data?
y=0
(Use integers or decimals for any numbers in the
expression. Round to the nearest tenth as needed.)
C
10-
Ау
8-
6-
4.
0-
0
2
4
too
6
too
10
Expert Solution
This question has been solved!
Explore an expertly crafted, step-by-step solution for a thorough understanding of key concepts.

This is a popular solution!

Trending now
This is a popular solution!

Step by step
Solved in 2 steps with 1 images

Recommended textbooks for you
Glencoe Algebra 1, Student Edition, 9780079039897…
Algebra
ISBN:
9780079039897
Author:
Carter
Publisher:
McGraw Hill

Algebra & Trigonometry with Analytic Geometry
Algebra
ISBN:
9781133382119
Author:
Swokowski
Publisher:
Cengage

Glencoe Algebra 1, Student Edition, 9780079039897…
Algebra
ISBN:
9780079039897
Author:
Carter
Publisher:
McGraw Hill
Algebra & Trigonometry with Analytic Geometry
Algebra
ISBN:
9781133382119
Author:
Swokowski
Publisher:
Cengage

Big Ideas Math A Bridge To Success Algebra 1: Stu…
Algebra
ISBN:
9781680331141
Author:
HOUGHTON MIFFLIN HARCOURT
Publisher:
Houghton Mifflin Harcourt

Functions and Change: A Modeling Approach to Coll…
Algebra
ISBN:
9781337111348
Author:
Bruce Crauder, Benny Evans, Alan Noell
Publisher:
Cengage Learning

Elementary Linear Algebra (MindTap Course List)
Algebra
ISBN:
9781305658004
Author:
Ron Larson
Publisher:
Cengage Learning