1. Why is energy needed to boil water? 2. When water is heated, the temperature eventually reaches a constant value (as in lines 2 and 4 on the graph) and forms a plateau on the graph. What does the plateau indicate? 3. 175 g of water (1) was heated from 15°C to 88°C. How many kilojoules were absorbed by the water?
1. Why is energy needed to boil water? 2. When water is heated, the temperature eventually reaches a constant value (as in lines 2 and 4 on the graph) and forms a plateau on the graph. What does the plateau indicate? 3. 175 g of water (1) was heated from 15°C to 88°C. How many kilojoules were absorbed by the water?

Chapter16: Data Processing With Excel
Section: Chapter Questions
Problem 4P

Related questions
Question
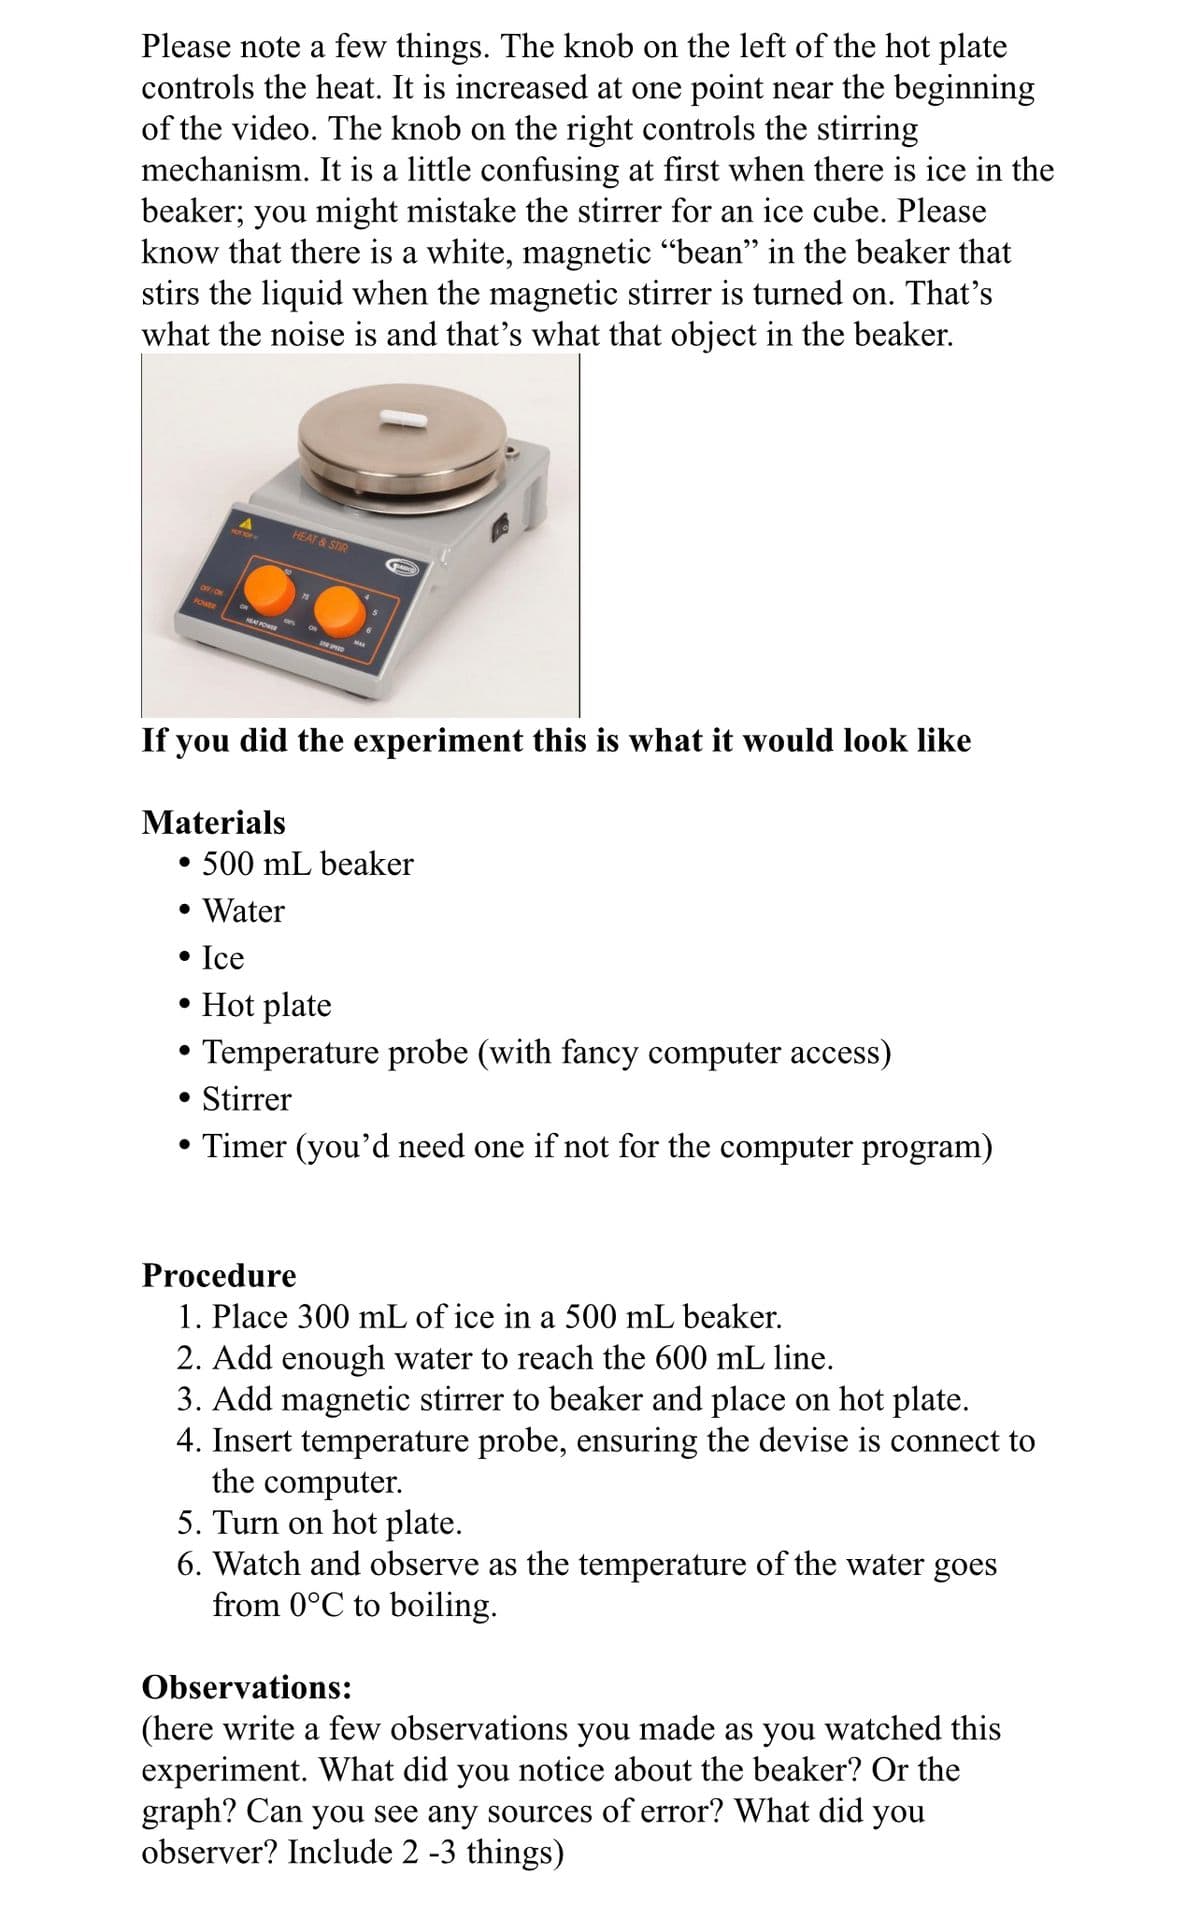
Transcribed Image Text:Please note a few things. The knob on the left of the hot plate
controls the heat. It is increased at one point near the beginning
of the video. The knob on the right controls the stirring
mechanism. It is a little confusing at first when there is ice in the
beaker; you might mistake the stirrer for an ice cube. Please
know that there is a white, magnetic "bean" in the beaker that
stirs the liquid when the magnetic stirrer is turned on. That's
what the noise is and that's what that object in the beaker.
HEAT & STIR
OFF/ON
POWER
ON
100
HAT POWR
If you did the experiment this is what it would look like
Materials
• 500 mL beaker
• Water
• Ice
• Hot plate
• Temperature probe (with fancy computer access)
• Stirrer
• Timer (you'd need one if not for the computer program)
Procedure
1. Place 300 mL of ice in a 500 mL beaker.
2. Add enough water to reach the 600 mL line.
3. Add magnetic stirrer to beaker and place on hot plate.
4. Insert temperature probe, ensuring the devise is connect to
the computer.
5. Turn on hot plate.
6. Watch and observe as the temperature of the water goes
from 0°C to boiling.
(here write a few observations you made as you watched this
experiment. What did you notice about the beaker? Or the
graph? Can you see any sources of error? What did you
observer? Include 2 -3 things)
Observations:
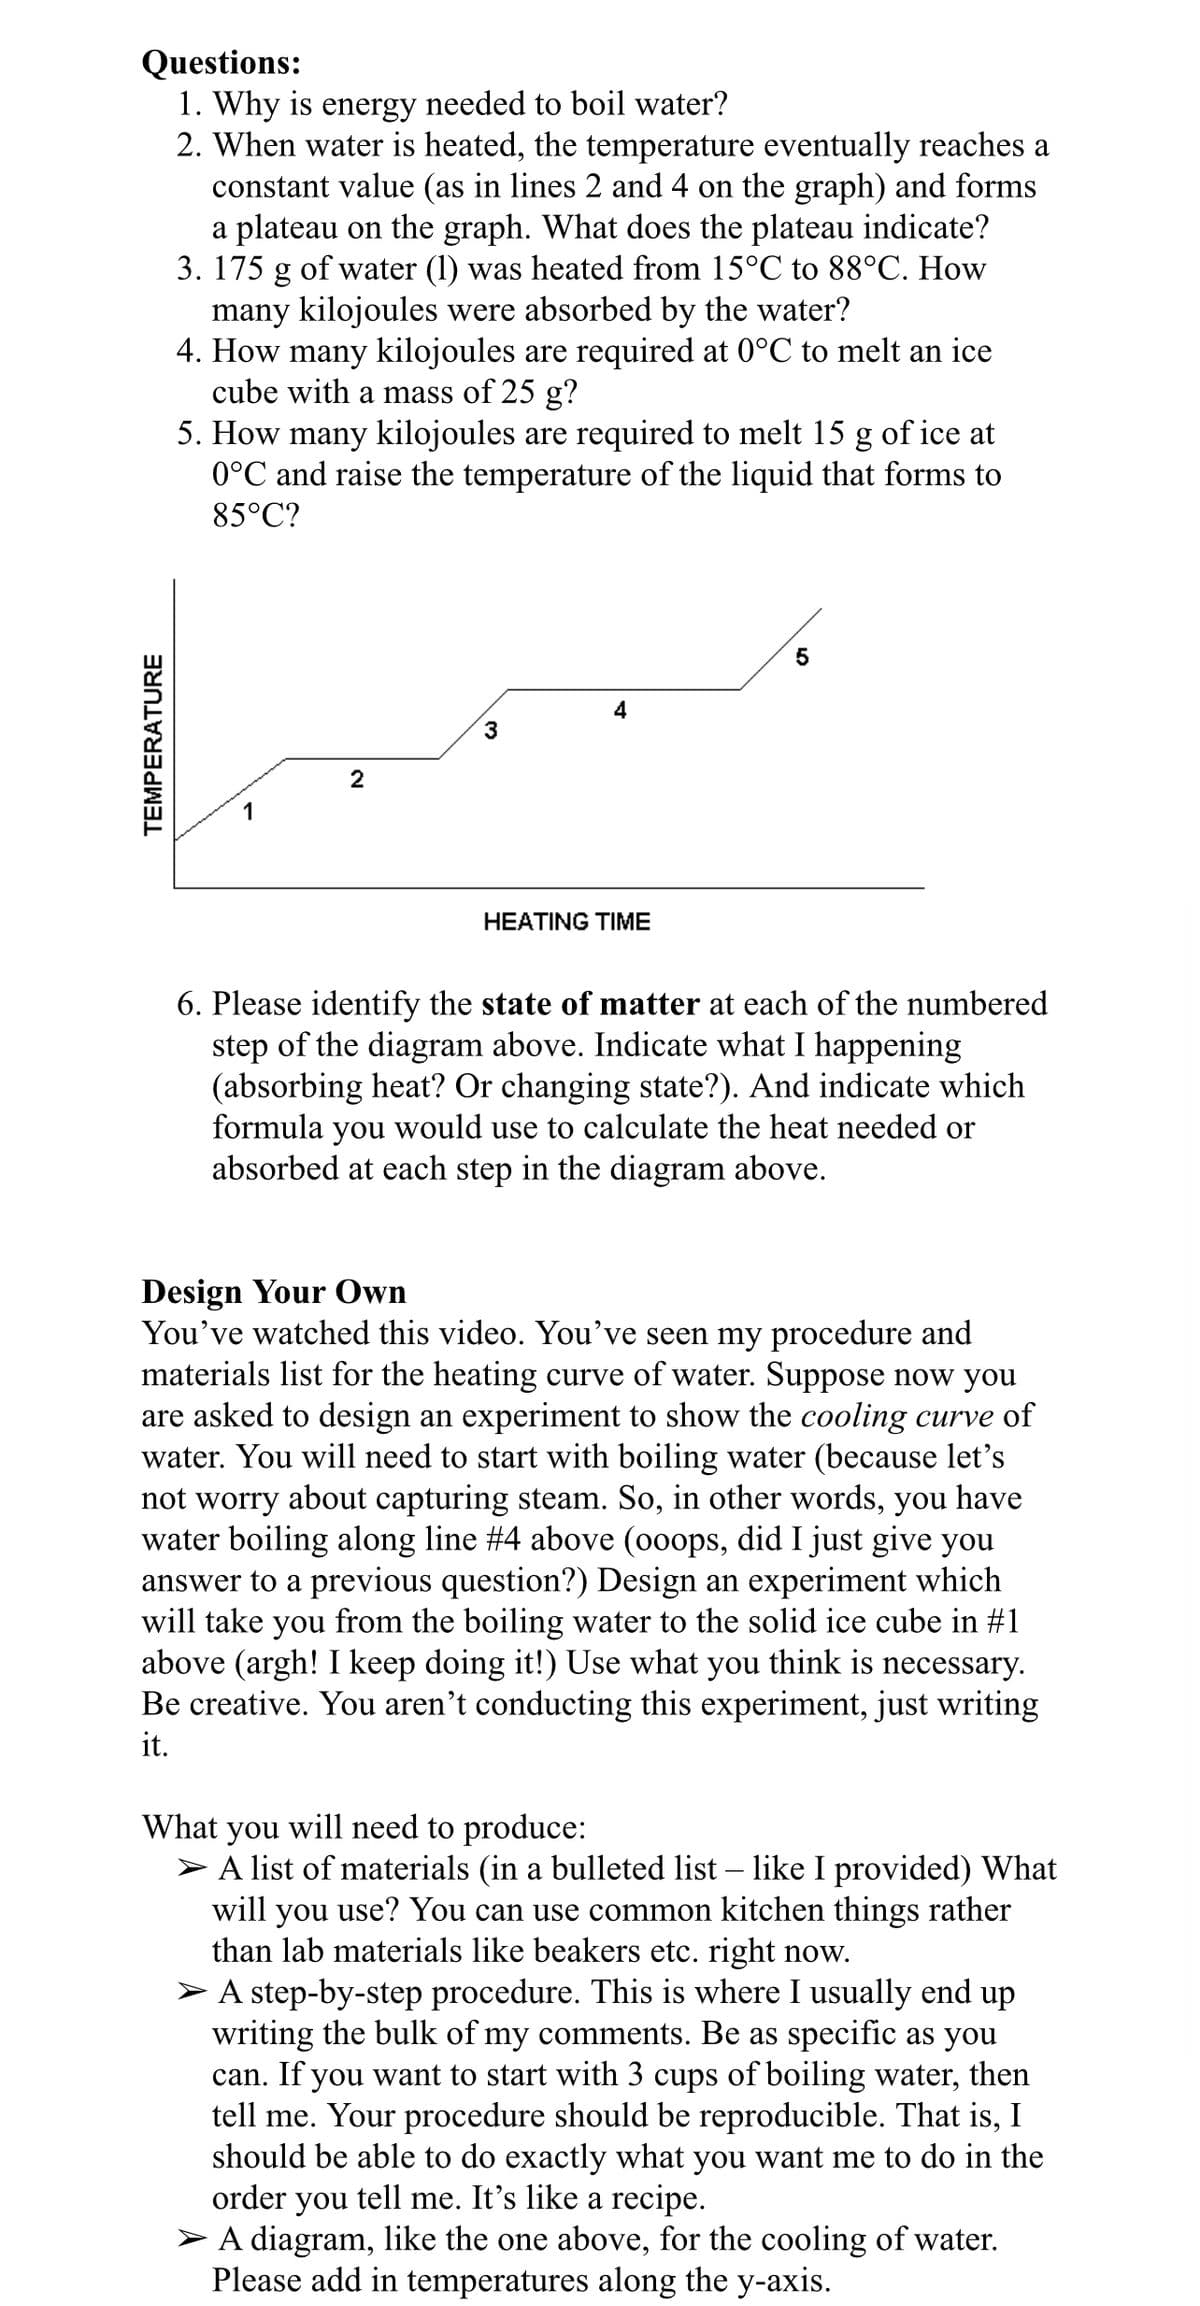
Transcribed Image Text:Questions:
1. Why is energy needed to boil water?
2. When water is heated, the temperature eventually reaches a
constant value (as in lines 2 and 4 on the graph) and forms
a plateau on the graph. What does the plateau indicate?
3. 175 g of water (1) was heated from 15°C to 88°C. How
many kilojoules were absorbed by the water?
4. How many kilojoules are required at 0°C to melt an ice
cube with a mass of 25 g?
5. How many kilojoules are required to melt 15 g of ice at
0°C and raise the temperature of the liquid that forms to
85°C?
3
2
HEATING TIME
6. Please identify the state of matter at each of the numbered
step of the diagram above. Indicate what I happening
(absorbing heat? Or changing state?). And indicate which
formula
you
would use to calculate the heat needed or
absorbed at each step in the diagram above.
Design Your Own
You've watched this video. You've seen my procedure and
materials list for the heating curve of water. Suppose now you
are asked to design an experiment to show the cooling curve of
water. You will need to start with boiling water (because let's
not worry about capturing steam. So, in other words, you have
water boiling along line #4 above (o0ops, did I just give you
answer to a previous question?) Design an experiment which
will take you from the boiling water to the solid ice cube in #1
above (argh! I keep doing it!) Use what you think is necessary.
Be creative. You aren’t conducting this experiment, just writing
it.
What
will need to produce:
you
A list of materials (in a bulleted list – like I provided) What
will you use? You can use common kitchen things rather
than lab materials like beakers etc. right now.
> A step-by-step procedure. This is where I usually end up
writing the bulk of my comments. Be as specific as you
can. If you want to start with 3 cups of boiling water, then
tell me. Your procedure should be reproducible. That is, I
should be able to do exactly what you want me to do in the
order you tell me. It's like a recipe.
A diagram, like the one above, for the cooling of water.
Please add in temperatures along the y-axis.
TEMPERATURE
Expert Solution
This question has been solved!
Explore an expertly crafted, step-by-step solution for a thorough understanding of key concepts.

This is a popular solution!

Trending now
This is a popular solution!

Step by step
Solved in 4 steps with 3 images

Knowledge Booster


Learn more about
Need a deep-dive on the concept behind this application? Look no further. Learn more about this topic, chemistry and related others by exploring similar questions and additional content below.Recommended textbooks for you

Principles of Instrumental Analysis
Chemistry
ISBN:
9781305577213
Author:
Douglas A. Skoog, F. James Holler, Stanley R. Crouch
Publisher:
Cengage Learning
Principles of Instrumental Analysis
Chemistry
ISBN:
9781305577213
Author:
Douglas A. Skoog, F. James Holler, Stanley R. Crouch
Publisher:
Cengage Learning