4. Negative Predictive Value 5. Accuracy 6.

MATLAB: An Introduction with Applications
6th Edition
ISBN:9781119256830
Author:Amos Gilat
Publisher:Amos Gilat
Chapter1: Starting With Matlab
Section: Chapter Questions
Problem 1P

Related questions
Question
A new screening test for thyroid cancer was administered to 1,000 adult volunteers at a large medical center complex in Europe. The results showed that 152 out of 160
diagnosed cases of thyroid cancer were correctly identified by the screening test. Also, of the 840 individuals without thyroid cancer, the screening test correctly identified 714.
Base on this information, calculate the test's:
1. Sensitivity
2. Specificity
3. Positive predictive value
4. Negative Predictive Value
5. Accuracy
6. Prevalence rate.
Please help with 4,5,6. I have attached 1,2,3.
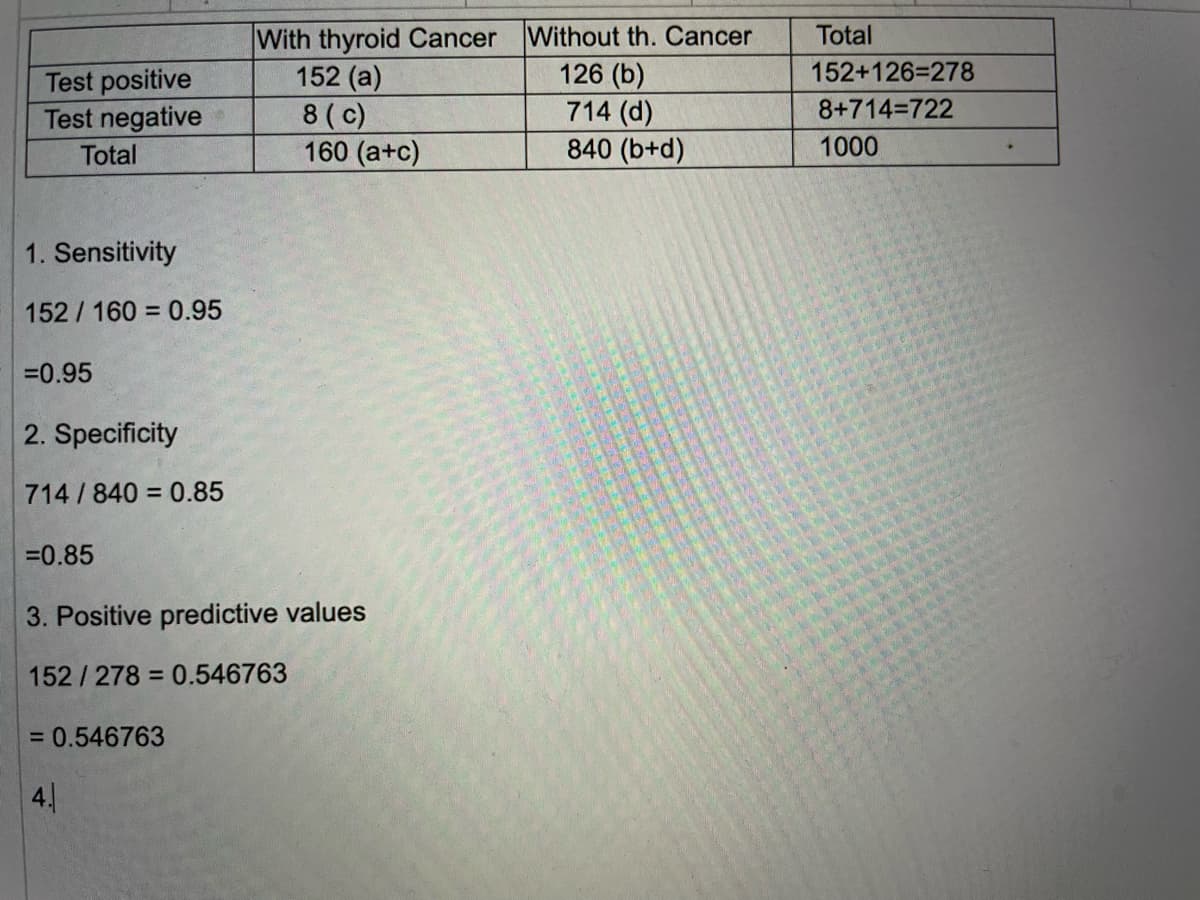
Transcribed Image Text:Test positive
Test negative
Total
1. Sensitivity
152/160 = 0.95
=0.95
2. Specificity
714/840 = 0.85
=0.85
=
With thyroid Cancer Without th. Cancer
152 (a)
126 (b)
3. Positive predictive values
152/278 0.546763
= 0.546763
4.
8 (c)
160 (a+c)
714 (d)
840 (b+d)
Total
152+126=278
8+714=722
1000
Expert Solution
This question has been solved!
Explore an expertly crafted, step-by-step solution for a thorough understanding of key concepts.

Step by step
Solved in 4 steps

Recommended textbooks for you
MATLAB: An Introduction with Applications
Statistics
ISBN:
9781119256830
Author:
Amos Gilat
Publisher:
John Wiley & Sons Inc

Probability and Statistics for Engineering and th…
Statistics
ISBN:
9781305251809
Author:
Jay L. Devore
Publisher:
Cengage Learning

Statistics for The Behavioral Sciences (MindTap C…
Statistics
ISBN:
9781305504912
Author:
Frederick J Gravetter, Larry B. Wallnau
Publisher:
Cengage Learning
MATLAB: An Introduction with Applications
Statistics
ISBN:
9781119256830
Author:
Amos Gilat
Publisher:
John Wiley & Sons Inc
Probability and Statistics for Engineering and th…
Statistics
ISBN:
9781305251809
Author:
Jay L. Devore
Publisher:
Cengage Learning
Statistics for The Behavioral Sciences (MindTap C…
Statistics
ISBN:
9781305504912
Author:
Frederick J Gravetter, Larry B. Wallnau
Publisher:
Cengage Learning

Elementary Statistics: Picturing the World (7th E…
Statistics
ISBN:
9780134683416
Author:
Ron Larson, Betsy Farber
Publisher:
PEARSON

The Basic Practice of Statistics
Statistics
ISBN:
9781319042578
Author:
David S. Moore, William I. Notz, Michael A. Fligner
Publisher:
W. H. Freeman

Introduction to the Practice of Statistics
Statistics
ISBN:
9781319013387
Author:
David S. Moore, George P. McCabe, Bruce A. Craig
Publisher:
W. H. Freeman