7. Short-run supply and long-run equilibrium Consider the competitive market for rhenium. Assume that no matter how many firms operate in the industry, every firm is identical and faces the same marginal cost (MC), average total cost (ATC), and average variable cost (AVC) curves plotted in the following graph. COSTS (Dollars per pound) 64 ATC 48 40 MC ° AVC 12 15 18 21 24 27 30 QUANTITY (Thousands of pounds) The following graph plots the market demand curve for rhenium. ? Use the orange points (square symbol) to plot the initial short-run industry supply curve when there are 10 firms in the market. (Hint: You can disregard the portion of the supply curve that corresponds to prices where there is no output since this is the industry supply curve.) Next, use the purple points (diamond symbol) to plot the short-run industry supply curve when there are 20 firms. Finally, use the green points (triangle symbol) to plot the short-run industry supply curve when there are 30 firms. -D- 72 64 Supply (10 firms) 56 Demand 48 Supply (20 firms) 40 32 24 16 ° O 120 240 360 480 600 720 640 960 1060 1200 QUANTITY (Thousands of pounds) Supply (30 firms) would If there were 30 firms in this market, the short-run equilibrium price of rhenium would be . Therefore, in the long run, firms would per pound. At that price, firms in this industry the rhenium market. Because you know that competitive firms earn S economic profit in the long run, you know the long-run equilibrium price must be per pound. From the graph, you can see that this means there will be firms operating in the rhenium industry in long-run equilibrium. True or False: Assuming implicit costs are positive, each of the firms operating in this industry in the long run eams positive accounting profit. True O False
7. Short-run supply and long-run equilibrium Consider the competitive market for rhenium. Assume that no matter how many firms operate in the industry, every firm is identical and faces the same marginal cost (MC), average total cost (ATC), and average variable cost (AVC) curves plotted in the following graph. COSTS (Dollars per pound) 64 ATC 48 40 MC ° AVC 12 15 18 21 24 27 30 QUANTITY (Thousands of pounds) The following graph plots the market demand curve for rhenium. ? Use the orange points (square symbol) to plot the initial short-run industry supply curve when there are 10 firms in the market. (Hint: You can disregard the portion of the supply curve that corresponds to prices where there is no output since this is the industry supply curve.) Next, use the purple points (diamond symbol) to plot the short-run industry supply curve when there are 20 firms. Finally, use the green points (triangle symbol) to plot the short-run industry supply curve when there are 30 firms. -D- 72 64 Supply (10 firms) 56 Demand 48 Supply (20 firms) 40 32 24 16 ° O 120 240 360 480 600 720 640 960 1060 1200 QUANTITY (Thousands of pounds) Supply (30 firms) would If there were 30 firms in this market, the short-run equilibrium price of rhenium would be . Therefore, in the long run, firms would per pound. At that price, firms in this industry the rhenium market. Because you know that competitive firms earn S economic profit in the long run, you know the long-run equilibrium price must be per pound. From the graph, you can see that this means there will be firms operating in the rhenium industry in long-run equilibrium. True or False: Assuming implicit costs are positive, each of the firms operating in this industry in the long run eams positive accounting profit. True O False

Essentials of Economics (MindTap Course List)
8th Edition
ISBN:9781337091992
Author:N. Gregory Mankiw
Publisher:N. Gregory Mankiw
Chapter13: Firms In Competitive Markets
Section: Chapter Questions
Problem 8PA

Related questions
Question
Transcribed Image Text:7. Short-run supply and long-run equilibrium
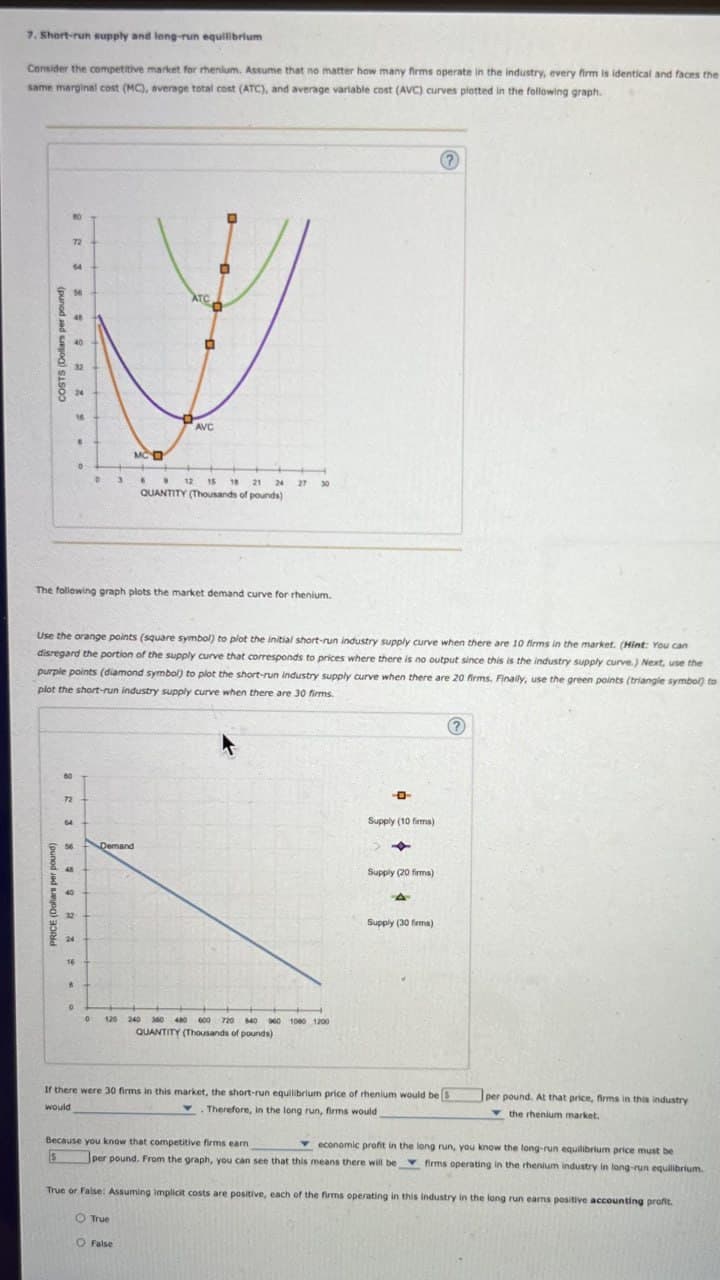
Consider the competitive market for rhenium. Assume that no matter how many firms operate in the industry, every firm is identical and faces the
same marginal cost (MC), average total cost (ATC), and average variable cost (AVC) curves plotted in the following graph.
COSTS (Dollars per pound)
64
ATC
48
40
MC
°
AVC
12 15 18 21 24 27 30
QUANTITY (Thousands of pounds)
The following graph plots the market demand curve for rhenium.
?
Use the orange points (square symbol) to plot the initial short-run industry supply curve when there are 10 firms in the market. (Hint: You can
disregard the portion of the supply curve that corresponds to prices where there is no output since this is the industry supply curve.) Next, use the
purple points (diamond symbol) to plot the short-run industry supply curve when there are 20 firms. Finally, use the green points (triangle symbol) to
plot the short-run industry supply curve when there are 30 firms.
-D-
72
64
Supply (10 firms)
56
Demand
48
Supply (20 firms)
40
32
24
16
°
O
120 240 360 480 600 720 640 960 1060 1200
QUANTITY (Thousands of pounds)
Supply (30 firms)
would
If there were 30 firms in this market, the short-run equilibrium price of rhenium would be
. Therefore, in the long run, firms would
per pound. At that price, firms in this industry
the rhenium market.
Because you know that competitive firms earn
S
economic profit in the long run, you know the long-run equilibrium price must be
per pound. From the graph, you can see that this means there will be firms operating in the rhenium industry in long-run equilibrium.
True or False: Assuming implicit costs are positive, each of the firms operating in this industry in the long run eams positive accounting profit.
True
O False
Expert Solution
This question has been solved!
Explore an expertly crafted, step-by-step solution for a thorough understanding of key concepts.

This is a popular solution!

Trending now
This is a popular solution!

Step by step
Solved in 2 steps

Recommended textbooks for you
Essentials of Economics (MindTap Course List)
Economics
ISBN:
9781337091992
Author:
N. Gregory Mankiw
Publisher:
Cengage Learning

Principles of Economics 2e
Economics
ISBN:
9781947172364
Author:
Steven A. Greenlaw; David Shapiro
Publisher:
OpenStax

Principles of Economics (MindTap Course List)
Economics
ISBN:
9781305585126
Author:
N. Gregory Mankiw
Publisher:
Cengage Learning
Essentials of Economics (MindTap Course List)
Economics
ISBN:
9781337091992
Author:
N. Gregory Mankiw
Publisher:
Cengage Learning
Principles of Economics 2e
Economics
ISBN:
9781947172364
Author:
Steven A. Greenlaw; David Shapiro
Publisher:
OpenStax
Principles of Economics (MindTap Course List)
Economics
ISBN:
9781305585126
Author:
N. Gregory Mankiw
Publisher:
Cengage Learning

Principles of Economics, 7th Edition (MindTap Cou…
Economics
ISBN:
9781285165875
Author:
N. Gregory Mankiw
Publisher:
Cengage Learning

Principles of Microeconomics (MindTap Course List)
Economics
ISBN:
9781305971493
Author:
N. Gregory Mankiw
Publisher:
Cengage Learning

Principles of Microeconomics
Economics
ISBN:
9781305156050
Author:
N. Gregory Mankiw
Publisher:
Cengage Learning