7. The snowshoe hare population in a newly created conservation area can be (t) = 50 + 2500t² 25+12, predicted over time by the model p where p represents the population size and t is the time in years since the opening of the conservation area. The graph of p(t) is shown below: 2000- 1000- 10 15 20 25 a) Determine the average rate of change in the interval from 2 years to 5 years. b) Determine the instantaneous rate of change at 3 years.
7. The snowshoe hare population in a newly created conservation area can be (t) = 50 + 2500t² 25+12, predicted over time by the model p where p represents the population size and t is the time in years since the opening of the conservation area. The graph of p(t) is shown below: 2000- 1000- 10 15 20 25 a) Determine the average rate of change in the interval from 2 years to 5 years. b) Determine the instantaneous rate of change at 3 years.

Functions and Change: A Modeling Approach to College Algebra (MindTap Course List)
6th Edition
ISBN:9781337111348
Author:Bruce Crauder, Benny Evans, Alan Noell
Publisher:Bruce Crauder, Benny Evans, Alan Noell
Chapter1: Functions
Section1.2: Functions Given By Tables
Problem 32SBE: Does a Limiting Value Occur? A rocket ship is flying away from Earth at a constant velocity, and it...

Related questions
Question
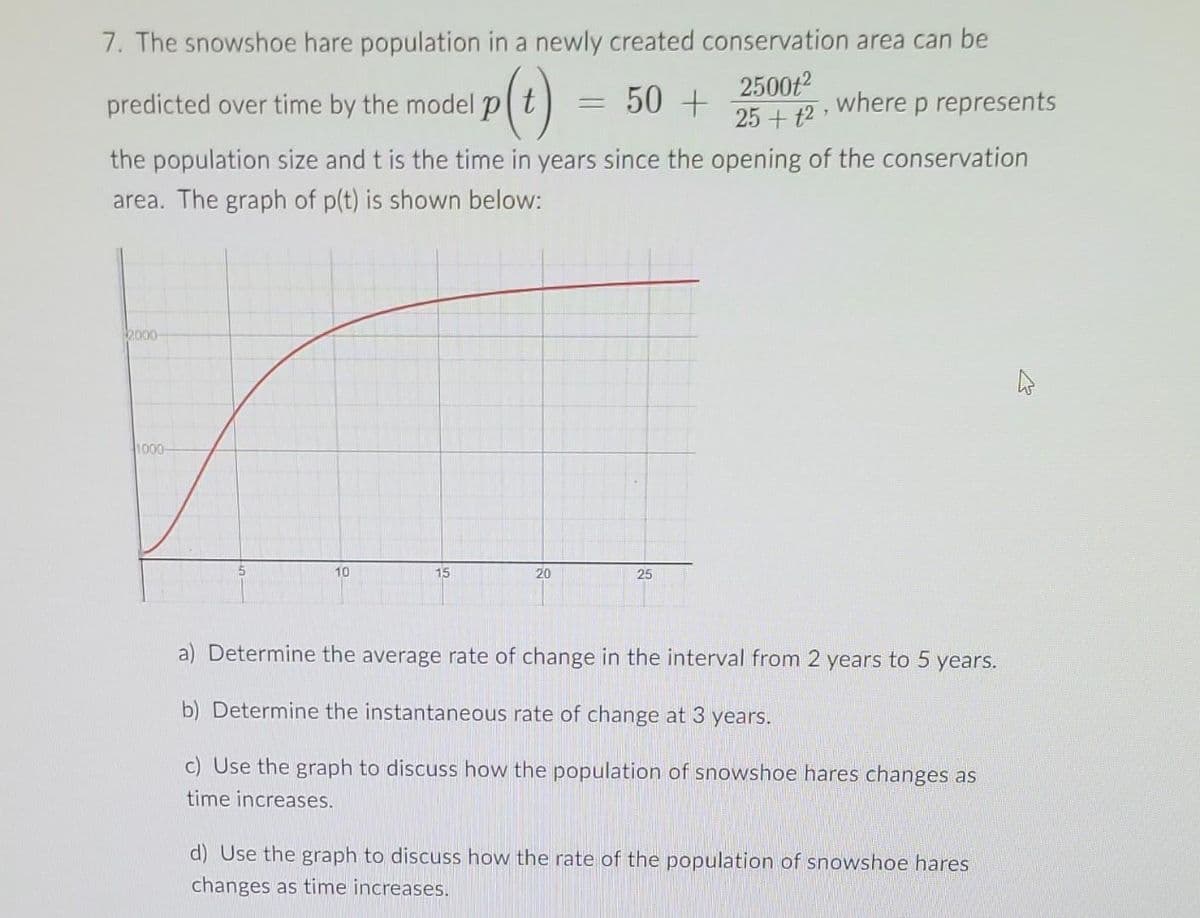
Transcribed Image Text:7. The snowshoe hare population in a newly created conservation area can be
p(t)
50 +
predicted over time by the model p
=
2500t²
25+12,
where p represents
the population size and t is the time in years since the opening of the conservation
area. The graph of p(t) is shown below:
2000-
1000-
10
15
20
25
a) Determine the average rate of change in the interval from 2 years to 5 years.
b) Determine the instantaneous rate of change at 3 years.
c) Use the graph to discuss how the population of snowshoe hares changes as
time increases.
d) Use the graph to discuss how the rate of the population of snowshoe hares
changes as time increases.
Expert Solution
This question has been solved!
Explore an expertly crafted, step-by-step solution for a thorough understanding of key concepts.

Step by step
Solved in 5 steps

Recommended textbooks for you
Functions and Change: A Modeling Approach to Coll…
Algebra
ISBN:
9781337111348
Author:
Bruce Crauder, Benny Evans, Alan Noell
Publisher:
Cengage Learning

Big Ideas Math A Bridge To Success Algebra 1: Stu…
Algebra
ISBN:
9781680331141
Author:
HOUGHTON MIFFLIN HARCOURT
Publisher:
Houghton Mifflin Harcourt

Algebra & Trigonometry with Analytic Geometry
Algebra
ISBN:
9781133382119
Author:
Swokowski
Publisher:
Cengage
Functions and Change: A Modeling Approach to Coll…
Algebra
ISBN:
9781337111348
Author:
Bruce Crauder, Benny Evans, Alan Noell
Publisher:
Cengage Learning
Big Ideas Math A Bridge To Success Algebra 1: Stu…
Algebra
ISBN:
9781680331141
Author:
HOUGHTON MIFFLIN HARCOURT
Publisher:
Houghton Mifflin Harcourt
Algebra & Trigonometry with Analytic Geometry
Algebra
ISBN:
9781133382119
Author:
Swokowski
Publisher:
Cengage

Trigonometry (MindTap Course List)
Trigonometry
ISBN:
9781337278461
Author:
Ron Larson
Publisher:
Cengage Learning