9.51 Student Ages Suppose that 200 statistics students each took a random sample (with replacement) of 50 students at their college and recorded the ages of the students in their sample. Then each student used his or her data to calculate a 95% confidence interval for the mean age of all students at the college. How many of the 200 intervals would you expect to capture the true population mean age, and how many expect not to capture the true population mean? Explain by showing would you your calculation.
9.51 Student Ages Suppose that 200 statistics students each took a random sample (with replacement) of 50 students at their college and recorded the ages of the students in their sample. Then each student used his or her data to calculate a 95% confidence interval for the mean age of all students at the college. How many of the 200 intervals would you expect to capture the true population mean age, and how many expect not to capture the true population mean? Explain by showing would you your calculation.

Glencoe Algebra 1, Student Edition, 9780079039897, 0079039898, 2018
18th Edition
ISBN:9780079039897
Author:Carter
Publisher:Carter
Chapter10: Statistics
Section10.4: Distributions Of Data
Problem 19PFA

Related questions
Question
9.51
Transcribed Image Text:lear
tion
red...
nd 9.2
AUG
9.50
9.51
9.52
A
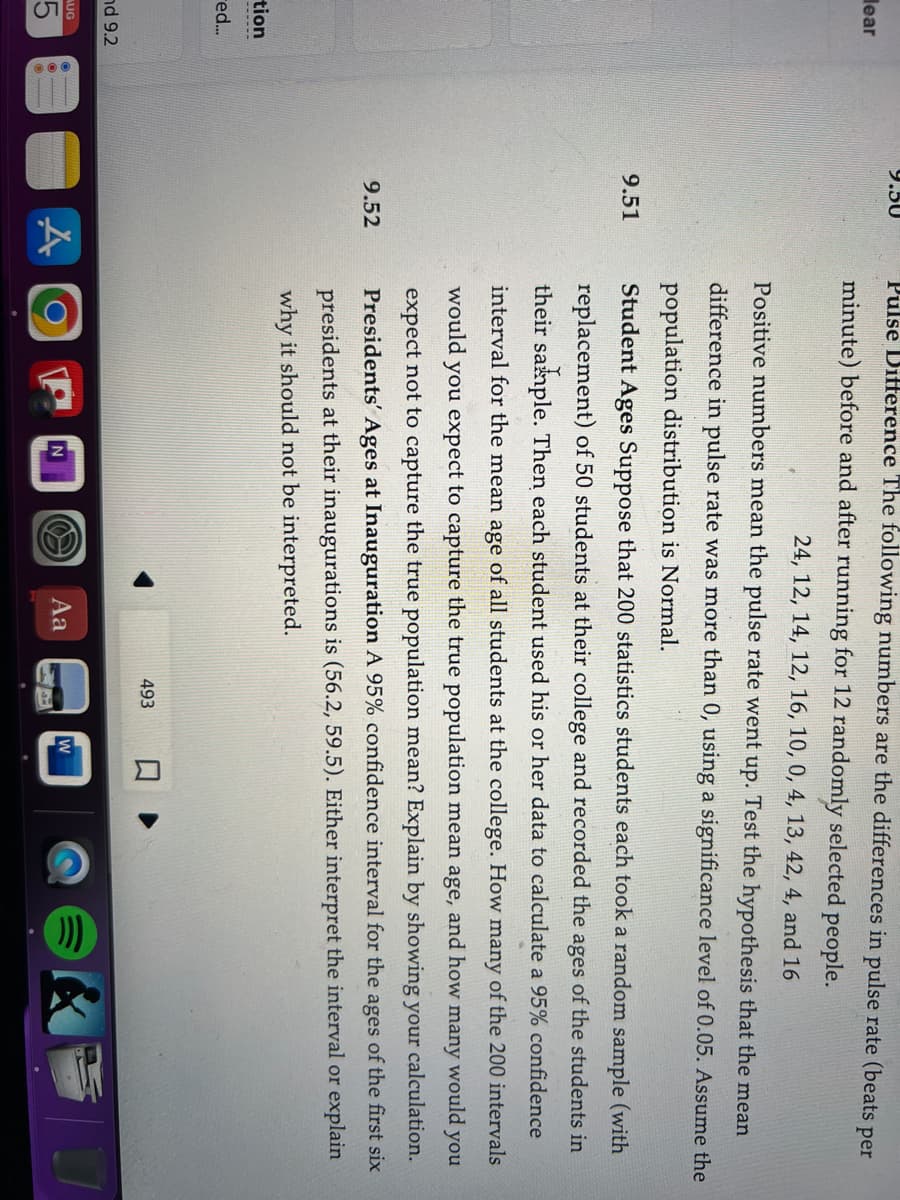
Pulse Difference The following numbers are the differences in pulse rate (beats per
minute) before and after running for 12 randomly selected people.
24, 12, 14, 12, 16, 10, 0, 4, 13, 42, 4, and 16
Positive numbers mean the pulse rate went up. Test the hypothesis that the mean
difference in pulse rate was more than 0, using a significance level of 0.05. Assume the
population distribution is Normal.
Student Ages Suppose that 200 statistics students each took a random sample (with
replacement) of 50 students at their college and recorded the ages of the students in
their sample. Then each student used his or her data to calculate a 95% confidence
interval for the mean age of all students at the college. How many of the 200 intervals
would you expect to capture the true population mean age, and how many would you
expect not to capture the true population mean? Explain by showing your calculation.
Presidents' Ages at Inauguration A 95% confidence interval for the ages of the first six
presidents at their inaugurations is (56.2, 59.5). Either interpret the interval or explain
why it should not be interpreted.
N
&
Aa
493
W
Expert Solution
This question has been solved!
Explore an expertly crafted, step-by-step solution for a thorough understanding of key concepts.

This is a popular solution!

Trending now
This is a popular solution!

Step by step
Solved in 2 steps

Recommended textbooks for you
Glencoe Algebra 1, Student Edition, 9780079039897…
Algebra
ISBN:
9780079039897
Author:
Carter
Publisher:
McGraw Hill
Glencoe Algebra 1, Student Edition, 9780079039897…
Algebra
ISBN:
9780079039897
Author:
Carter
Publisher:
McGraw Hill