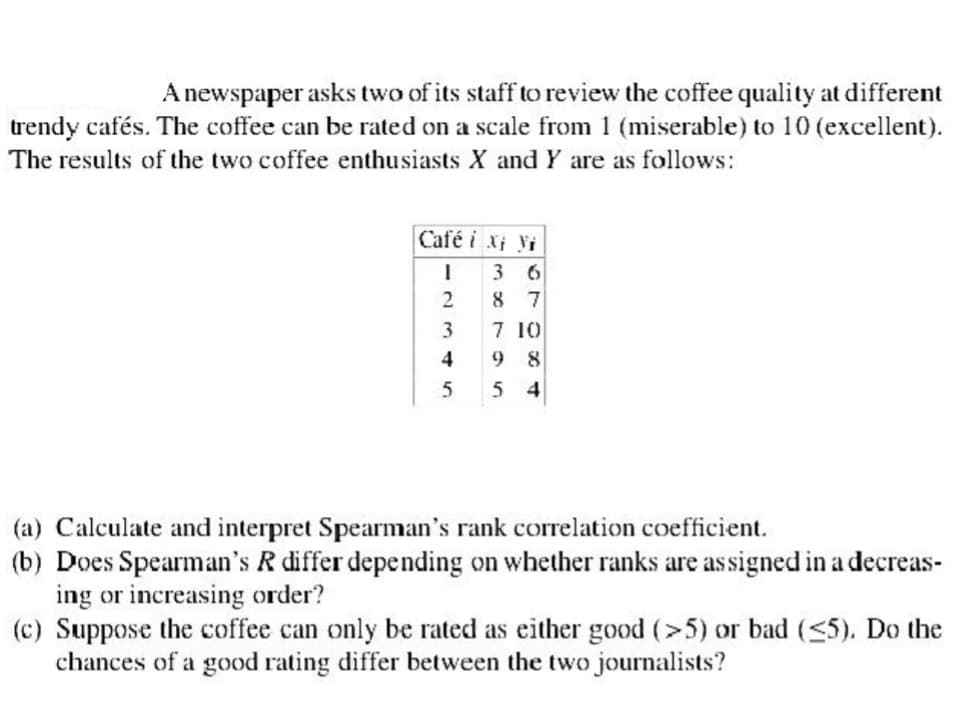
A newspaper asks two of its staff to review the coffee quality at different trendy cafés. The coffee can be rated on a scale from 1 (miserable) to 10 (excellent). The results of the two coffee enthusiasts X and Y are as follows: Café i Xi Vi 3 6 8 7 7 10 98 5 4 I 2 3 4 5 (a) Calculate and interpret Spearman's rank correlation coefficient. (b) Does Spearman's R differ depending on whether ranks are assigned in a decreas- ing or increasing order? (c) Suppose the coffee can only be rated as either good (>5) or bad (<5). Do the chances of a good rating differ between the two journalists?
Q: A survey was conducted that asked 1018 people how many books they had read in the past year. Results…
A: Given: Sample size n=1018 Sample mean x¯=12.8 Standard deviation s=16.6
Q: A sales manager for an advertising agency believes there is a relationship between the number of…
A: Slope is the changing variable in the regression equation. It is also known as regression…
Q: State whether the standardized test statistic t indicates that you should reject the null…
A: Given data The rejection region is t>1.845
Q: A researcher wanted to systematically investigate the effectiveness of restrain challenging…
A: x - independent variable y - dependent variable A, B and C - conditions are represented using…
Q: Solve the two simultaneous equations to show how Q and P depend on u and v.
A: From given information we have given: The demand for a commodity is : Qd=β0+β1P+uWhere,Q denotes…
Q: The table below shows the total annual precipitation for San Diego, California. 1994 1995 1996 1997…
A: Given: sample size(n)=10 Data: Year Precip(in) x 1994 9.4 1995 17 1996 7.3 1997 7 1998…
Q: A poll asked 1028 adults "If purchasing a used car made certain upgrades or features more…
A:
Q: Determine whether the following statement is true or false. If it is false, rewrite it as a true…
A: The given statement is 'The mean is the measure of central tendency most likely to be affected by an…
Q: WorldGross^=9.23+6.87⋅OpeningWeekend Is the interpretation for the y-intercept meaningful in…
A: The provided regression is: WorldGross^=9.23+6.87⋅OpeningWeekend
Q: Test the claim that the proportion of men who own cats is significantly different than the…
A: Given: For men: n1 = 40 p1 = 0.45 For women: n2 = 40 p2 = 0.65 Formula Used: Test-statistic Z =…
Q: If I have to carry out a rigorous inspection and I have a population of 300.000, how much sample…
A: Note: As per guidelines we will solve the first question only, please repost other questions for…
Q: a. Determine the point estimate for the average duration of all calls rounded to three decimal…
A: Hi! Thank you for the question, As per the honour code, we are allowed to answer three sub-parts at…
Q: USA Today reports that the average expenditure on Valentine's Day was expected to be $100.89. Do…
A:
Q: For the statement below, write the claim as a mathematical statement. State the null and alternative…
A:
Q: Find the amount in the account at the end of 1 year. $
A:
Q: Among drivers who have had a car crash in the last year, 210 were randomly selected and categorized…
A:
Q: a) Calculate the regression equation for height of son upon height of father. b) When the…
A: From given data : n=8 Height of Father (x) height of son (y) x-x y-y (x-x)2 (y-y)(x-x) 170 172…
Q: A manager at a local bank analyzed the relationship between monthly salary and three independent…
A: The t test for each coefficient of a linear regression model is tested for the null hypothesis H0:…
Q: You determined there was a positive correlation between the number of study hours a week a student…
A:
Q: The following values represent the distance (in miles) that a sample of 10 dating couples live from…
A:
Q: Using this confusion matrix, calculate the following predictive performance measure. (i) False…
A: From the given data; P N P 6 = TP 4 = FP N 3 = FN 7 = TN True Positive =TP True Negative…
Q: Determine whether the statement is true or false. If it is false, rewrite it as a true statement. In…
A: We have given that In a hypothesis test you assume the alternative hypothesis is true
Q: or the first blank my options are a. 3.95 b. 9.1 c. 4
A: years precipitation 1994 9.4 1995 17 1996 7.3 1997 7 1998 16.1 1999 5.4 2000 6.9…
Q: Consider the following hypothesis test: Ho: μ = 17 Ha: # 17 A sample of 50 provided a sample mean of…
A:
Q: Find the critical value(s) and rejection region(s) for the indicated t-test, level of significance…
A: Given Information: Sample size n=17 Significance level α=0.10 The hypothesis test is two-tailed.
Q: The marks obtained by 11 students as follows. You calculate quartile deviation and its coefficient.…
A:
Q: When a customer places an order with SunShine on-line supplies, a computerized accounting…
A:
Q: The mean of the frequency distribution is degrees. (Round to the nearest tenth as needed)
A:
Q: Blood pressure: High blood pressure has been identified as a risk factor for heart attacks and…
A: The sample size n is 42.
Q: Using the manual method, calculate the 60th Percentile for the following numbers: 24, 69, 2, 71, 60,…
A:
Q: A dataset contains data on birth weights of 65535 babies born in June 1997 along with variables that…
A: Given:- The difference between boys and girls estimated from this regression…
Q: Given in the table are the BMI statistics for random samples of men and women. Assume that the two…
A: It is given that the two samples are independent simple random samples selected from normally…
Q: peed (miles per hour) equency + 42-45 we mean of the frequency distribution is miles per hour ound…
A:
Q: Suppose you are doing a hypothesis test for a population proportion p, and we have: Ho: p=59.25% H₁:…
A:
Q: Q3. Consider the following data. Period…
A: For the given data What is the mean growth rate over these five periods?
Q: A programmer plans to develop a new software system. In planning for the operating system that he…
A:
Q: Match the situation with the calculator command. 1. Want to approximate the value of the percent of…
A: Given data To match the situation with the calculator command
Q: The area under the chi-square curve with 29 degrees of freedom from 6.2 to 59.5 is (Q10) The 30%…
A:
Q: How is the estimation affected if we estimate a linear regression (r = 1) when the true form of the…
A: Hint: By comparison of graphs of linear regression(r=1), quadratic(r=2) and cubic(r=3) Solution: So,…
Q: 8, 29, 29, 34, 37, 39, 40, 47, 49, 50, 57 Notice that the ages are ordered from least to greatest.…
A: When conducting descriptive analyses or conducting a preliminary evaluation of a large data set, a…
Q: Given are five observations for two variables, * and y. Excel File: data14-25.xlsx The estimated…
A: Given information:
Q: Given the sample results (2000 units in each random sample) in the following table: Random Sample…
A: Given that Random Number sample size number of defective fraction defective 1 2000 6 0.0030…
Q: Arbitron Media Research Incorporated conducted a study of the iPod listening habits of men and…
A: The following information has been provided: n1=9 n2=21x¯1=33…
Q: 7 8 9 According to the given information below, find answers question number 6 through question…
A: Hypothesis test are used to compare the sample and population. Hypothesis is the statement of…
Q: 9.55 Televisions: CI (Example 14-) Minitab output is shown for a two-sample t-interval for the…
A:
Q: Question: Given a contingency table, what is the name of the distribution we get when we take the…
A: A contingency table can summarise three probability distributions – joint, marginal, and…
Q: Suppose that in a random selection of 100 colored candies, 21% of them are blue. The candy company…
A: We have given thatn = 100p̂ = 0.21p = 0.25Significance level (α) = 0.10 The null and alternative…
Q: In this regression, which test statistic would you use to test the null hypothesis that the…
A: The prediction can be done by various time series method. It can be calculated using the regression…
Q: (a) Find the five-number summary, and (b) draw a box-and-whisker plot of the data. 3886298 79…
A: Given data set3,8,8,6,2,9,8,7,9,6,9,4,2,6,2,9,8,7,7,9
Q: 2. Researchers are trying to determine if there is a relationship between the average number of Pets…
A: The following solution is given below :
Step by step
Solved in 5 steps with 5 images
- Listed below are the overhead widths (in cm) of seals measured from photographs and the weights (in kg) of the seals. Construct a scatterplot, find the value of the linear correlation coefficient r, and find the critical values of r using alpha equals 0.05. Is there sufficient evidence to conclude that there is a linear correlation between overhead widths of seals from photographs and the weights of theseals? Overhead Width 7.1 7.6 9.7 9.3 8.6 8.2 Weight 115 197 243 198 197 186Listed below are the overhead widths (in cm) of seals measured from photographs and the weights (in kg) of the seals. Construct a scatterplot, find the value of the linear correlation coefficient r, and find the critical values of r using α=0.01. Overhead width overhead weight 7.1 111 7.6 164 9.8 250 9.2 192 8.8 205 8.2 183 Is there sufficient evidence to conclude that there is a linear correlation between overhead widths of seals from photographs and the weights of the seals? The linear correlation coefficient is r=? (Round to three decimal places as needed.) The linear correlation coefficient is r=? (Round to three decimal places as needed.) The critical values are r=? (Round to three decimal places as needed. Use a comma to separate answers as needed.) Because the absolute value of the linear correlation coefficient is ______ than the positive critical value, there _______ sufficient evidence to support the claim that there is a linear…Listed below are the overhead widths (in cm) of seals measured from photographs and the weights (in kg) of the seals. Construct a scatterplot, find the value of the linear correlation coefficient r, and find the critical values of r using α=0.01. Is there sufficient evidence to conclude that there is a linear correlation between overhead widths of seals from photographs and the weights of the seals?
- Listed below are the overhead widths (in cm) of seals measured from photographs and the weights (in kg) of the seals. Construct a scatterplot, find the value of the linear correlation coefficient r, and find the critical values of r using α=0.05. Is there sufficient evidence to conclude that there is a linear correlation between overhead widths of seals from photographs and the weights of the seals? Overhead Width 7.1 7.6 9.6 9.2 8.7 8.2 Weight 113 173 242 192 200 188 PLOTS INSERTED AS PICTURE The linear correlation coefficient is r=________. (Round to three decimal places as needed.) The critical values are r=________. (Round to three decimal places as needed. Use a comma to separate answers as needed.) Because the absolute value of the linear correlation coefficient is ▼ less greater than the positive critical value, there ▼ is not is sufficient evidence to support the claim that there is a…Listed below are the overhead widths (in cm) of seals measured from photographs and the weights (in kg) of the seals. Construct a scatterplot, find the value of the linear correlation coefficient r, and find the critical values of r using alpha equals 0.01. Is there sufficient evidence to conclude that there is a linear correlation between overhead widths of seals from photographs and the weights of the seals? a. Construct a scatterplot. b. The linear correlation coefficient is r= (Round to three decimal places as needed.) c. The critical values are r= (Round to three decimal places as needed. Use a comma to separate answers as needed.)Listed below are the overhead widths (in cm) of seals measured from photographs and the weights (in kg) of the seals. Construct a scatterplot, find the value of the linear correlation coefficient r, and find the critical values of r using alpha equals 0.01 .Is there sufficient evidence to conclude that there is a linear correlation between overhead widths of seals from photographs and the weights of the seals? a. Construct a scatterplot. b. The linear correlation coefficient is r equals (Round to three decimal places as needed.) c. The critical values are r equals (Round to three decimal places as needed. Use a comma to separate answers as needed.)