A recent study indicates that, on average, the typical American spends 2.57 hours per day surfing the internet on a mobile device. You are curious as to whether men and women spend differing amounts of time per day accessing the internet through a mobile device. To test this idea, you (a) selected a random sample of 30 men and 30 women, (b) collected times spent per day that each participant in your study spent accessing the internet through a mobile device (in hours), and (c) performed several analyses on the data. Results of these analyses appear below: t-Test: Two-Sample Assuming Equal Variances t-Test: Two-Sam ple Assuming Unequal Variances Men Women Men Women Mean 2.5523 1.9333 Mean 2.5523 1.9333 Variance 2.5232 1.1678 Variance 2.5232 1.1678 Observations 30 30 Observations 30 30 Pooled Variance 1.8455 Hypothesized Mean Difference Hypothesized Mean Difference df 51 df 58 t Štat 1.7647 P(T<=t) one-tail t Critical one-tail P(T<=t) two-tail t Critical two-tail t Stat 1.7647 0.0418 P(T<=t) one-tail t Critical one-tail 0.0414 1.6753 1.6716 0.0836 P(T<=t) two-tail t Critical two-tail 0.0829 2.0076 2.0017 F-Test Two-Sample for Variances z-Test: Two Sample for Means Men Women Men Women Mean 2.5523 1.9333 Mean 2.5523 1.9333 Variance 2.5232 1.1678 Known Variance 2.534 1.1678 Observations 30 30 Observations 30 30 df 29 29 Hypothesized Mean Difference F 2.1606 1.7622 P(F<=f) one-tail F Critical one-tail P(Z<=z) one-tail z Critical one-tail 0.0211 0.039 1.8608 1.6449 P(Z<=z) two-tail z Critical two-tail 0.078 1.96 What is the value of the test statistic you would use to test the correct hypothesis? t= 1.76 z= 1.762 t= 2.00 F = 1.861
A recent study indicates that, on average, the typical American spends 2.57 hours per day surfing the internet on a mobile device. You are curious as to whether men and women spend differing amounts of time per day accessing the internet through a mobile device. To test this idea, you (a) selected a random sample of 30 men and 30 women, (b) collected times spent per day that each participant in your study spent accessing the internet through a mobile device (in hours), and (c) performed several analyses on the data. Results of these analyses appear below: t-Test: Two-Sample Assuming Equal Variances t-Test: Two-Sam ple Assuming Unequal Variances Men Women Men Women Mean 2.5523 1.9333 Mean 2.5523 1.9333 Variance 2.5232 1.1678 Variance 2.5232 1.1678 Observations 30 30 Observations 30 30 Pooled Variance 1.8455 Hypothesized Mean Difference Hypothesized Mean Difference df 51 df 58 t Štat 1.7647 P(T<=t) one-tail t Critical one-tail P(T<=t) two-tail t Critical two-tail t Stat 1.7647 0.0418 P(T<=t) one-tail t Critical one-tail 0.0414 1.6753 1.6716 0.0836 P(T<=t) two-tail t Critical two-tail 0.0829 2.0076 2.0017 F-Test Two-Sample for Variances z-Test: Two Sample for Means Men Women Men Women Mean 2.5523 1.9333 Mean 2.5523 1.9333 Variance 2.5232 1.1678 Known Variance 2.534 1.1678 Observations 30 30 Observations 30 30 df 29 29 Hypothesized Mean Difference F 2.1606 1.7622 P(F<=f) one-tail F Critical one-tail P(Z<=z) one-tail z Critical one-tail 0.0211 0.039 1.8608 1.6449 P(Z<=z) two-tail z Critical two-tail 0.078 1.96 What is the value of the test statistic you would use to test the correct hypothesis? t= 1.76 z= 1.762 t= 2.00 F = 1.861

Holt Mcdougal Larson Pre-algebra: Student Edition 2012
1st Edition
ISBN:9780547587776
Author:HOLT MCDOUGAL
Publisher:HOLT MCDOUGAL
Chapter11: Data Analysis And Probability
Section: Chapter Questions
Problem 8CR

Related questions
Question
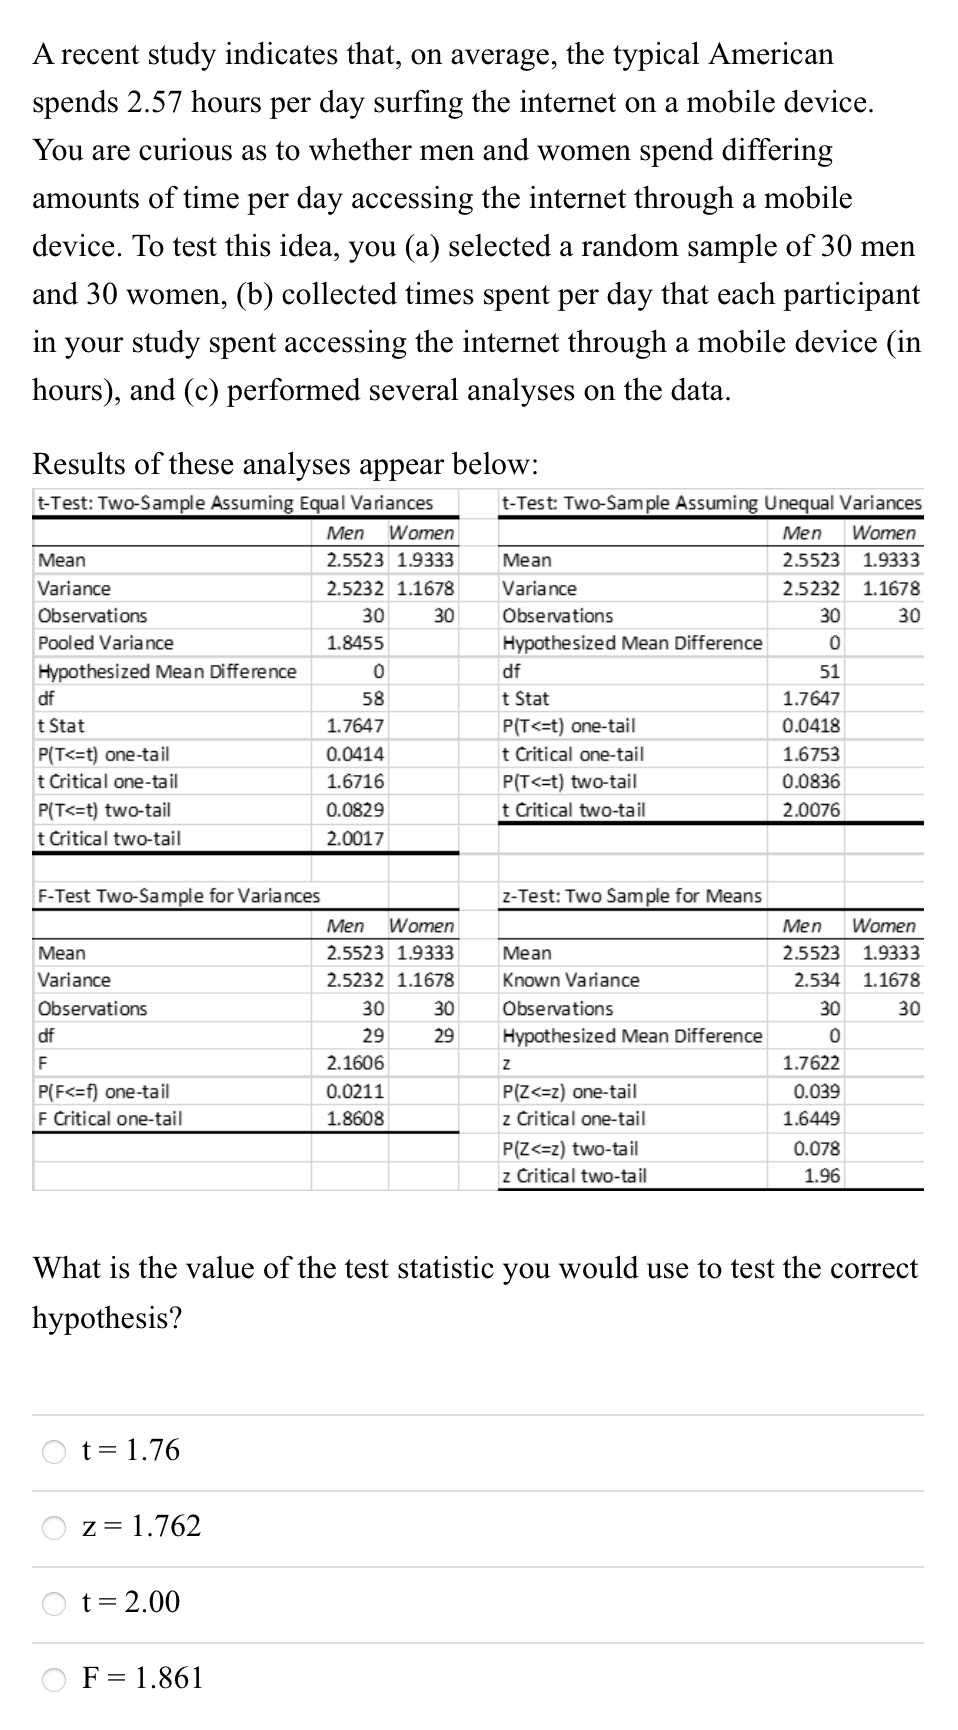
Transcribed Image Text:A recent study indicates that, on average, the typical American
spends 2.57 hours per day surfing the internet on a mobile device.
You are curious as to whether men and women spend differing
amounts of time per day accessing the internet through a mobile
device. To test this idea, you (a) selected a random sample of 30 men
and 30 women, (b) collected times spent per day that each participant
in your study spent accessing the internet through a mobile device (in
hours), and (c) performed several analyses on the data.
Results of these analyses appear below:
t-Test: Two-Sample Assuming Equal Variances
t-Test: Two-Sample Assuming Unequal Variances
Men
Women
Men
Women
Mean
2.5523 1.9333
Mean
2.5523
1.9333
Variance
2.5232 1.1678
Variance
2.5232
1.1678
Observations
30
30
Observations
30
30
Pooled Variance
1.8455
Hypothesized Mean Difference
Hypothesized Mean Difference
df
51
df
58
t Štat
1.7647
P(T<=t) one-tail
t Critical one-tail
P(T<=t) two-tail
t Critical two-tail
t Stat
1.7647
0.0418
P(T<=t) one-tail
t Critical one-tail
0.0414
1.6753
1.6716
0.0836
P(T<=t) two-tail
t Critical two-tail
0.0829
2.0076
2.0017
F-Test Two-Sample for Variances
z-Test: Two Sample for Means
Men
Women
Men
Women
Mean
2.5523 1.9333
Mean
2.5523
1.9333
Variance
2.5232 1.1678
Known Variance
2.534
1.1678
Observations
30
30
Observations
30
30
df
29
29
Hypothesized Mean Difference
F
2.1606
1.7622
P(F<=f) one-tail
F Critical one-tail
P(Z<=z) one-tail
z Critical one-tail
0.0211
0.039
1.8608
1.6449
P(Z<=z) two-tail
z Critical two-tail
0.078
1.96
What is the value of the test statistic you would use to test the correct
hypothesis?
t= 1.76
z= 1.762
t= 2.00
F = 1.861
Expert Solution
This question has been solved!
Explore an expertly crafted, step-by-step solution for a thorough understanding of key concepts.

This is a popular solution!

Trending now
This is a popular solution!

Step by step
Solved in 5 steps

Recommended textbooks for you
Holt Mcdougal Larson Pre-algebra: Student Edition…
Algebra
ISBN:
9780547587776
Author:
HOLT MCDOUGAL
Publisher:
HOLT MCDOUGAL

College Algebra (MindTap Course List)
Algebra
ISBN:
9781305652231
Author:
R. David Gustafson, Jeff Hughes
Publisher:
Cengage Learning

Holt Mcdougal Larson Pre-algebra: Student Edition…
Algebra
ISBN:
9780547587776
Author:
HOLT MCDOUGAL
Publisher:
HOLT MCDOUGAL
College Algebra (MindTap Course List)
Algebra
ISBN:
9781305652231
Author:
R. David Gustafson, Jeff Hughes
Publisher:
Cengage Learning