
MATLAB: An Introduction with Applications
6th Edition
ISBN: 9781119256830
Author: Amos Gilat
Publisher: John Wiley & Sons Inc
expand_more
expand_more
format_list_bulleted
Related questions
Concept explainers
Question
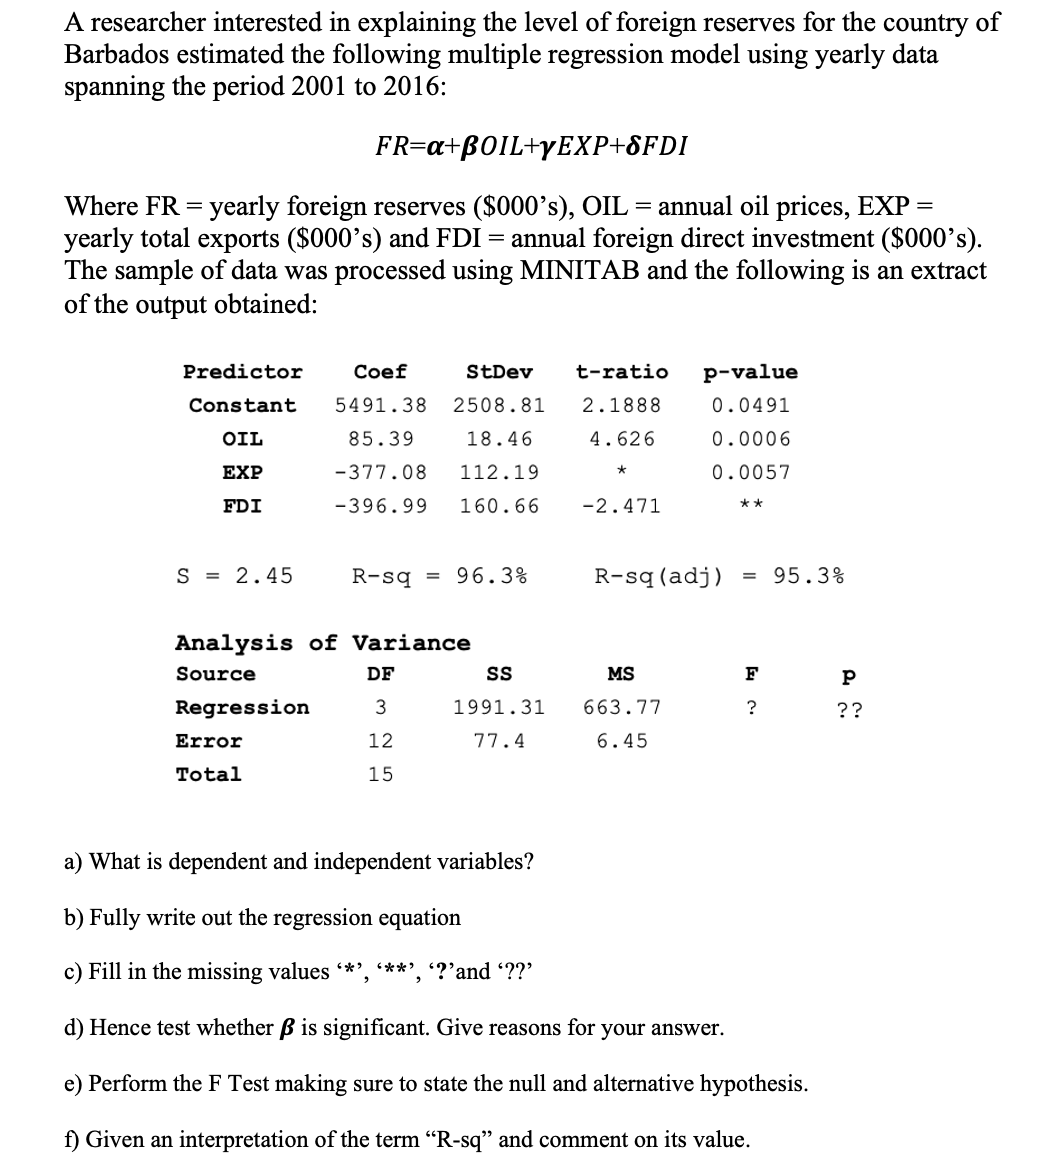

Transcribed Image Text:A researcher interested in explaining the level of foreign reserves for the country of
Barbados estimated the following multiple regression model using yearly data
spanning the period 2001 to 2016:
FR=a+BOIL+yEXP+8FDI
Where FR = yearly foreign reserves ($000's), OIL = annual oil prices, EXP =
yearly total exports ($000's) and FDI = annual foreign direct investment ($000's).
The sample of data was processed using MINITAB and the following is an extract
of the output obtained:
Predictor
Сoef
StDev
t-ratio
p-value
Constant
5491.38
2508.81
2.1888
0.0491
OIL
85.39
18.46
4.626
0.0006
EXP
-377.08
112.19
0.0057
FDI
-396.99
160.66
-2.471
**
S = 2.45
R-sq
96.3%
R-sq (adj)
95.3%
Analysis of Variance
Source
DF
MS
F
Regression
1991.31
663.77
??
Error
12
77.4
6.45
Total
15
a) What is dependent and independent variables?
b) Fully write out the regression equation
c) Fill in the missing values *', ***', '?'and ??'
d) Hence test whether B is significant. Give reasons for your answer.
e) Perform the F Test making sure to state the null and alternative hypothesis.
f) Given an interpretation of the term "R-sq" and comment on its value.
Expert Solution
This question has been solved!
Explore an expertly crafted, step-by-step solution for a thorough understanding of key concepts.

Step by stepSolved in 4 steps

Knowledge Booster


Learn more about
Need a deep-dive on the concept behind this application? Look no further. Learn more about this topic, statistics and related others by exploring similar questions and additional content below.Similar questions
- Define Residuals or errors in Alternative Regression Models?arrow_forwardIn a regression study, relating Price/unit (x) to Weekly Sales (in Kg.), with the scatter plot showing a strong negative direction, 63% of the variability in sales could be accounted for by the variation in the Unit Price. The correlation coefficient in this study is: 0.79 -0.4 -0.79 0.4arrow_forwardDescribe the correlation coefficient and explain how it is used in regression analysis?arrow_forward
- Hello! Please analyse the table 3 and 4 in the image attached. the data is supposed to see if there is a relationship between the prevalence of obesity(table3) or life expectancy (table4) between males and females. thank you!arrow_forwardA researcher is studying the intensity of hurricanes that entered the Gulf of Mexico between 1975-2015 and the average water temperature of the Gulf of Mexico at the hurricane's peak strength. What is the independent and dependent variable in this study?arrow_forwardSeedlings of understory trees in mature tropical rainforests must survive and grow using intermittent flecks of sunlight. How does the length of exposure to these flecks of sunlight (fleck duration) affect growth? Researchers experimentally irradiated seedlings of the Southeast Asian rainforest tree with flecks of light of varying duration while maintaining the same total irradiance to all the seedlings. Below is the data. Fit a linear model to the data. Tree Mean Fleck (min) Relative growth rate (mm/mm/week 1 3.4 0.013 2 3.2 0.008 3 3 0.007 4 2.7 0.005 5 2.8 0.003 6 3.2 0.003 7 2.2 0.005 8 2.2 0.003 9 2.4 0 10 4.4 0.009 11 5.1 0.01 12 6.3 0.009 13 7.3 0.009 14 6 0.016 15 5.9 0.025 16 7.1 0.021 17 8.8 0.024 18 7.4 0.019 19 7.5 0.016 20 7.5 0.014 21 7.9 0.014 a)What is the rate of change in relative growth…arrow_forward
arrow_back_ios
arrow_forward_ios
Recommended textbooks for you
- MATLAB: An Introduction with ApplicationsStatisticsISBN:9781119256830Author:Amos GilatPublisher:John Wiley & Sons Inc
 Probability and Statistics for Engineering and th...StatisticsISBN:9781305251809Author:Jay L. DevorePublisher:Cengage Learning
 Statistics for The Behavioral Sciences (MindTap C...StatisticsISBN:9781305504912Author:Frederick J Gravetter, Larry B. WallnauPublisher:Cengage Learning
  Elementary Statistics: Picturing the World (7th E...StatisticsISBN:9780134683416Author:Ron Larson, Betsy FarberPublisher:PEARSON
 The Basic Practice of StatisticsStatisticsISBN:9781319042578Author:David S. Moore, William I. Notz, Michael A. FlignerPublisher:W. H. Freeman
 Introduction to the Practice of StatisticsStatisticsISBN:9781319013387Author:David S. Moore, George P. McCabe, Bruce A. CraigPublisher:W. H. Freeman
MATLAB: An Introduction with Applications
Statistics
ISBN:9781119256830
Author:Amos Gilat
Publisher:John Wiley & Sons Inc
Probability and Statistics for Engineering and th...
Statistics
ISBN:9781305251809
Author:Jay L. Devore
Publisher:Cengage Learning
Statistics for The Behavioral Sciences (MindTap C...
Statistics
ISBN:9781305504912
Author:Frederick J Gravetter, Larry B. Wallnau
Publisher:Cengage Learning
Elementary Statistics: Picturing the World (7th E...
Statistics
ISBN:9780134683416
Author:Ron Larson, Betsy Farber
Publisher:PEARSON
The Basic Practice of Statistics
Statistics
ISBN:9781319042578
Author:David S. Moore, William I. Notz, Michael A. Fligner
Publisher:W. H. Freeman
Introduction to the Practice of Statistics
Statistics
ISBN:9781319013387
Author:David S. Moore, George P. McCabe, Bruce A. Craig
Publisher:W. H. Freeman