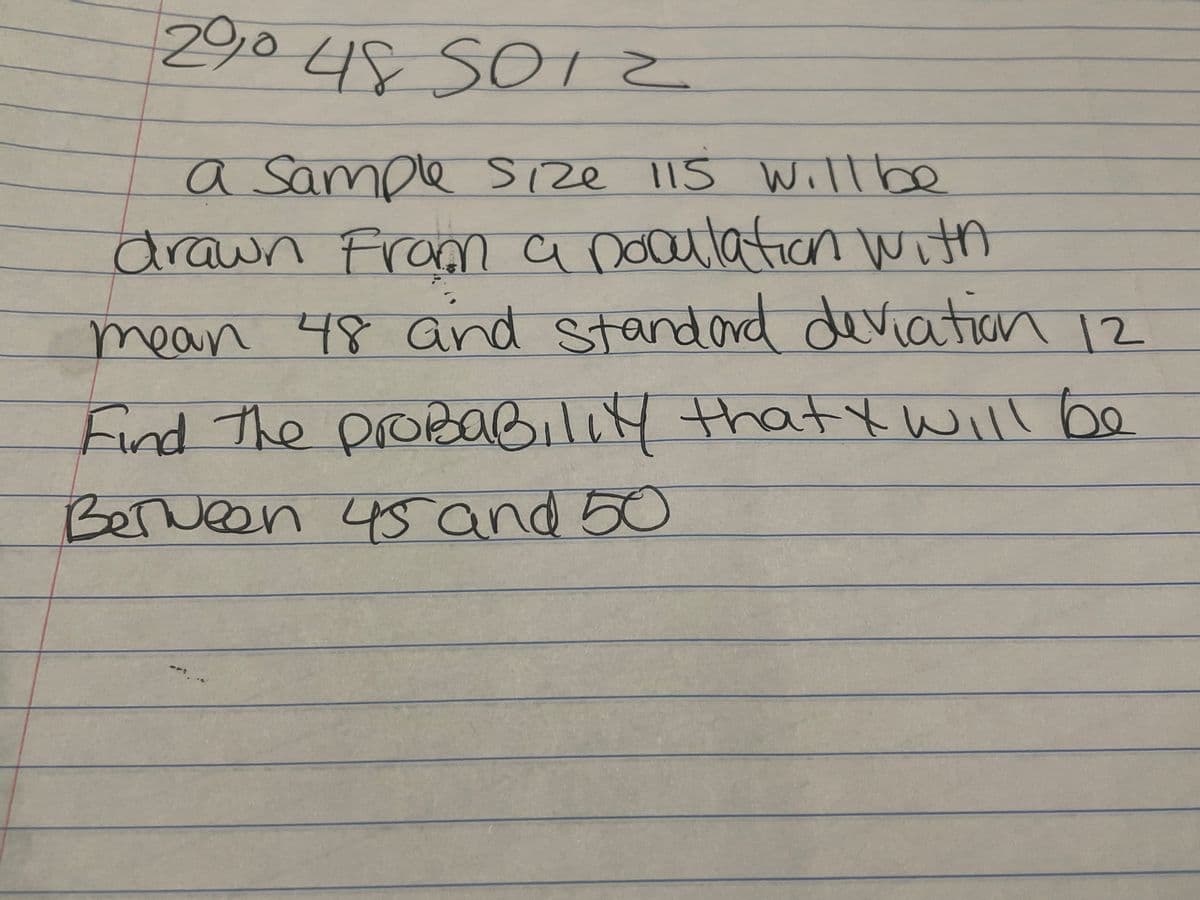
a Sample Size 115 will be drawn from a poculation with mean 48 and standard deviation 12 Find the probability that I will be Between 45 and 50


Q: The number of credits being taken by a sample of 13 full-time college students are listed below.…
A: Given that Data : 5 7 8 8 5 6 4 4 4 4 4 4 5 We have to find mean, median and mode of data
Q: d. Draw the graph of the equation in part (a) by plotting the points from part (c) and connecting…
A: Given X=no of miles travelled Y=total cost We need to determine the graph which suits the equation…
Q: a. Sketch or use technology to create the curve and label on the x-axis the position of the mean,…
A: From given data we have ; As N~85,5 Mean μ = 80 Standard deviation σ = 5
Q: Use the given data set to answer parts (a) and (b). a. Find the regression equation for the data…
A:
Q: Using the following information: Coefficients Intercept -12.8094 Independent variable 2.1794…
A: We have given the following information in the form of table Coefficients Intercept…
Q: The test statistic of z= - 1.56 is obtained when testing the claim that p < 0.51. A) using a…
A: We have given that Test statistic (z) = -1.56 p < 0.51 (claim) Hence, it is left tailed test…
Q: Find the Rank correlation for the following distribution 39 52 30 48 60 72 62 56 40 62 78 65 70 38…
A:
Q: A sales manager for an advertising agency believes there is a relationship between the number of…
A: We have given that following ANOVA table df SS MS F Significance F Regression 1.00…
Q: A sales manager for an advertising agency believes there is a relationship between the number of…
A: Slope is the changing variable in the regression equation. It is also known as regression…
Q: Consider the following hypothesis test: Ho: μ = 17 Ha: # 17 A sample of 50 provided a sample mean of…
A: GivenThe null and hypothesis test isH0:μ=17Ha:μ≠17sample size(n)=50sample mean(x)=14.37population…
Q: (a) Find the five-number summary, and (b) draw a box-and-whisker plot of the data. 3886298 79…
A: Given data set3,8,8,6,2,9,8,7,9,6,9,4,2,6,2,9,8,7,7,9
Q: Listed below are systolic blood pressure measurements (in mm Hg) obtained from the same woman. Find…
A:
Q: Fitness App Use and Gender (Example 6) In a 2015 study reported in the Journal of American College…
A: From the provided information, Use Male Female Total Yes 84 268 352 No 9…
Q: A population has standard deviation G = 17.1. Part 1 of 2 (a) How large a sample must be drawn so…
A:
Q: 7. Find the Q.D. and coefficient of Q.D. from the following data. Size Frequency 3.5 4.5 5.5 6.5 5 7…
A: Given that X Frequency 3.5 5 4.5 7 5.5 22 6.5 60 7.5 85 8.5 32 9.5 8
Q: 8, 29, 29, 34, 37, 39, 40, 47, 49, 50, 57 Notice that the ages are ordered from least to greatest.…
A: When conducting descriptive analyses or conducting a preliminary evaluation of a large data set, a…
Q: Students took a college math placement exam with a mean of 200 and a standard deviation of 12. Using…
A: Given that, μ=200σ=12
Q: P 12 1 4 8 31 с 6 B 14
A:
Q: can you solve this question for me by showing it step by step for calculations? thanks in advance…
A: Given Information: Sample size n=75 Out of which x=43 people were in favor of Electric Vehicles.
Q: The goals scored per game by a soccer team represent the first quartile for all teams in a league.…
A: Quartile It is a measure which divide the data into four equal parts. First part is representation…
Q: (a) Suppose you collect a SRS of size n from a population and from the data collected you computed a…
A: Solution: We will discuss the relation between confidence level and width of the confidence…
Q: Consider the multiple regression model shown next between the dependent variable Y and four…
A:
Q: Comparing F-Values from Boxplots (Example 30) Refer to the figure. Assume that all distributions are…
A: In ANOVA the test is conducted for the null hypothesis, H0 : the means of every groups are equal…
Q: A local teacher wants to see if teaching writing in different ways impacts student learning. She has…
A: Statistical Testing: An application for creating detailed evaluations about an activity is a…
Q: 1 a)A survey is designed to investigate the average hourly wage in the US. It is known that the…
A:
Q: X follows a continuous uniform distribution {} 0 f(x)= Applying the central limit theorem with a…
A:
Q: 170 Are Humans Like Random Number Generators? (Example 30) One of the authors collected data from a…
A: Given: Integer observed 1 3 2 5 3 14 4 11 5 5 38 Level of significance = 0.050
Q: Does training in stress reduction make a difference for student success? 15 students received…
A:
Q: A sales manager for an advertising agency believes there is a relationship between the number of…
A: Solution : Given , A regression analysis shows the following results. Coefficients Standard Error…
Q: A certain test is designed to measure the satisfaction of an individual with his/her relationship.…
A: The following information has been provided: Let X be a random variable represents the…
Q: The random variable X has a uniform distribution with values between 11 and 21. What is the mean…
A:
Q: Sleeping outlier: A simple random sample of ten college freshmen were asked how many hours of sleep…
A:
Q: Identify the sample space of the probability experiment and determine the number of outcomes in the…
A: Given: There is a probability experiment. Rolling a die. We need to find, Total sample space. Total…
Q: Consider a contingency table with two rows and five columns. a. Find the degrees of freedom. b. Find…
A: The number of rows is 2 and the number of columns is 5.
Q: Which value of r indicates a stronger correlation: r=0.797 or r= -0.922? Explain your reasoning.…
A:
Q: (in inches) 0.00-0.19 0.20-0.39 0.40-0,59 0.60-0.79 0.80-0.99 1.00-1.19 1.20-1.39 Frequency
A: Using given data Min = 0 Max = 1.22 Now we have make a class with an class width 0.20. Frequency…
Q: ate the z-score in questions 1-2 for the following SAMPLE data set that is from a standard al…
A:
Q: A dataset contains data on birth weights of 65535 babies born in June 1997 along with variables that…
A: * ANSWER :-
Q: 3. The decision-making process A graduate student believes that people consider faces with more…
A: Given info: A graduate student believes that people consider faces with more contrast between eye…
Q: In a regression model involving 30 observations, the following estimated regression equation was…
A:
Q: Consider the partially completed ANOVA summary table below. Complete parts a through d below. SS F…
A: Hey there! Thank you for posting the question. Since your question has more than 3 parts, we are…
Q: Determine whether the claim stated below represents the null hypothesis or the alternative…
A: Each hypothesis testing has two statements. Hypothesis is the statement of population parameter. Two…
Q: A data set about speed dating includes "like" ratings of male dates made by the female dates. The…
A: Population mean μ = 6 Sample size n = 197 Sample mean X = 5.81 Sample standard deviation s = 2.13…
Q: Find the critical value(s) and rejection region(s) for the indicated t-test, level of significance…
A:
Q: 2. Suppose that you take a random sample of 360 people who voted in the last election in a heavily…
A:
Q: Lablixoy if 2 = ax + by and r is the correlation cofficient between the two that is x and y. you…
A: Since you have asked multiple question, according to our guidelines we will solve the first question…
Q: Listed below are amounts (in millions of dollars) collected from parking meters by a security…
A: According to the given information in this question We need to find means for security company and…
Q: see the answer for #6 but can not find #7-10?
A:
Q: Find the (a) mean, (b) median, (c) mode, and (d) midrange for the given sample data. An experiment…
A: Central tendency measure the average of the data set. Measure of central tendency are mean, median…
Q: (a) State the null hypothesis Ho and the alternative hypothesis H₁. Ho: 0 H₁:0 (b) Determine the…
A: Given: Sample size, n is 8 Brand 1 Brand 2 Difference 0.43 0.43 0 0.62 0.48 0.14 0.35 0.2…


Trending now
This is a popular solution!

Step by step
Solved in 2 steps with 2 images
