
MATLAB: An Introduction with Applications
6th Edition
ISBN: 9781119256830
Author: Amos Gilat
Publisher: John Wiley & Sons Inc
expand_more
expand_more
format_list_bulleted
Related questions
Question
A social psychologist was interested in finding out whether the effect of leadership style on the productivity of workers at an assembly plant for fax machines. A team of 15 workers were supervised by democratic leaders, while a team 15 workers were supervised by autocratic leaders. The average number of fax machines assembled in an hour by each team was recorded. Conduct the 7 steps of hypothesis testing, including a t test to see if there was a significant difference between the two styles of leaders.
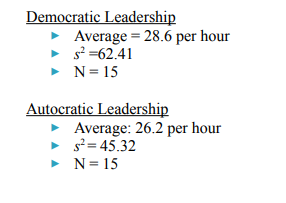

Transcribed Image Text:Democratic Leadership
Average = 28.6 per hour
► s² =62.41
► N = 15
Autocratic Leadership
▸ Average: 26.2 per hour
► s²=45.32
► N=15
Expert Solution
This question has been solved!
Explore an expertly crafted, step-by-step solution for a thorough understanding of key concepts.

This is a popular solution

Trending nowThis is a popular solution!

Step by stepSolved in 3 steps with 8 images

Knowledge Booster

Similar questions
- It is often useful for retailers to determine why their potential customers chose to visit their store. Possible reasons include advertising, advice from a friend, or previous experience. To determine the effect of full-page advertisements in the local newspaper, the owner of an electronic-equipment store asked randomly selected people who visited the store whether they had seen the ad. He also determined whether the customers had bought anything, and if so, how much they spent. Among the respondents who saw the ad, 49 made an average purchase of $97.38 with a variance of $622. Among the respondents who did not see the ad, 21 made an average purchase of $92.01 with a variance of $283.3. Can the owner conclude that customers who see the ad spend more than those who do not see the ad (among those who make a purchase) at 5% significance level? Population: One Two Multiple Formula #: Answer Hypothesis Null H0 : (μ, π, σ², μd, μ1 - μ2, π1- π2, σ₁²…arrow_forwardThe Consumer Reports Restaurant Customer Satisfaction Survey is based upon 148,599 visits to full-service restaurant chains (Consumer Reports website). One of the variables in the study is meal price, the average amount paid per person for dinner and drinks, minus the tip. Suppose a reporter for the Sun Coast Times thought that it would be of interest to her readers to conduct a similar study for restaurants located on the Grand Strand section in Myrtle Beach, South Carolina. The reporter selected a sample of 8 seafood restaurants, 8 Italian restaurants, and 8 steakhouses. The following data show the meal prices ($) obtained for the 24 restaurants sampled. Use a = 0.05 to test whether there is a significant difference among the mean meal price for the three types of restaurants. Please answer the questions in the image.arrow_forwardIn 2013, 46% of high school students tried a tobacco product. From a survey of 500 randomly selected high school students, how likely is it to get a proportion of 0.196 that tried a tobacco product?arrow_forward
- Need helparrow_forwardResearchers conducted two surveys about teens are their use of social media. The first survey asked a random sample of 800 U.S. teens about their use of Instagram. A second survey asked the same questions to a random sample of 2253 Canadian teens. In these two studies, 73% of U.S. teens and 88% of Canadian teens said that they use Instagram. Use these results to answer the following questions about the proportion of U.S. and Canadian teens that use Instagram. Is there a statistically significant difference between the use of social media by U.S. teens and Canadian teens? No, there is no difference between the proportion of U.S. teens that use Instagram and the proportion of Canadian teens that use Instagram because both the lower limit and the upper limit of the confidence interval are negative values. Yes, the proportion of U.S. teens that use Instagram is significantly less than the proportion of Canadian teens that use Instagram difference because both…arrow_forwardBrown wants to conduct an assessment of where employees live and how employees work. Brown wanted to know if where you lived was related to how you worked. What hypothesis tests can be used in this case?arrow_forward
- The Consumer Reports Restaurant Customer Satisfaction Survey is based upon 148,599 visits to full-service restaurant chains.t One of the variables in the study is meal price, the average amount paid per person for dinner and drinks, minus the tip. Suppose a reporter for the Sun Coast times thought that it would be of interest to her readers to conduct a similar study for restaurants located on the Grand Strand section in Myrtle Beach, South Carolina. The reporter selected a sample of 8 seafood restaurants, 8 Italian restaurants, and 8 steakhouses. The following data show the meal prices ($) obtained for the 24 restaurants sampled. Italian Seafood Steakhouse $12 $16 $24 13 18 19 15 17 23 17 26 25 18 23 21 20 15 22 17 19 27 24 18 31 Use a = 0.05 to test whether there is a significant difference among the mean meal price for the three types of restaurants. State the null and alternative hypotheses. O Ho: ralian * lseafood * lsteakhouse H: talian = lSeafood = ASteakhouse O Ho: Not all the…arrow_forwardA biologist is studying the composition of birds on a lake and counts 61 ducks, 17 geese, 11 cranes, 15 swans, and 6 herons. From previous studies performed around the same time of the year, she expects 50% of the birds to be ducks, 23% to be geese, 12% to be cranes, 10% to be swans, and 5% to be herons. What are the expected and observed counts? Select one. Expected = 55 ducks, 25 geese, 13 cranes, 11 swans, and 6 herons Observed = 61 ducks, 17 geese, 11 cranes, 15 swans, and 6 herons Expected = 61 ducks, 17 geese, 11 cranes, 15 swans, and 6 herons Observed 55 ducks, 25 geese, 13 cranes, 11 swans, and 6 herons %3D Expected = 55 ducks, 25 geese, 13 cranes, 11 swans, and 6 herons Observed = 55 ducks, 25 geese, 13 cranes, 11 swans, and 6 herons %3D %3D Expected = 61 ducks, 17 geese, 11 cranes, 15 swans, and 6 herons Observed = 61 ducks, 17 geese, 11 cranes, 15 swans, and 6 heronsarrow_forwardThe Consumer Reports Restaurant Customer Satisfaction Survey is based upon 148,599 visits to full-service restaurant chains (Consumer Reports website). One of the variables in the study is meal price, the average amount paid per person for dinner and drinks, minus the tip. Suppose a reporter for the Sun Coast Times thought that it would be of interest to her readers to conduct a similar study for restaurants located on the Grand Strand section in Myrtle Beach, South Carolina. The reporter selected a sample of 8 seafood restaurants, 8 Italian restaurants, and 8 steakhouses. The following data show the meal prices ($) obtained for the 24 restaurants sampled. Use a = 0.05 to test whether there is a significant difference among the mean meal price for the three types of restaurants. Source Sum of Squares Degrees Mean Square F P-value of Variation (to whole number) of Freedom (to 2 decimals) (to 2 decimals) (to 4 decimals) X X (X) * X * * Treatments Error Total The p-value is less than 0.01…arrow_forward
- A 2009 Pew Research Center survey asked a sample of 1,504 adults living in the United States for their opinions on recent technological advancements, such as online shopping, cell phones, and social networking. Respondents categorized each advancement as a change for the worse, hasn't made much difference, a change for the better, or don't know. A summary of respondents' opinions on the Internet follows: Response Change for the worse Hasn't made much difference Change for the better. Don't know Percent of Respondents 16 11 65 8 Make a bar graph of the relative frequency distribution of the responses.arrow_forwardWegman’s (a food market chain) has developed a new store-brand brownie mix. Before they start selling the mix they want to compare how well people like their brownies to brownies made from a popular national brand mix. In order to see if there was any difference in consumer opinion, Wegman’s asked 124 shoppers to participate in a taste test. Each was given a brownie to try. Subjects were not told which kind of brownie they got—that was determined randomly. 58% of the 62 shoppers who tasted a Wegman’s brownie said liked it well enough to buy the mix, compared to 66% of the others who said they would be willing to buy the national brand. Does this result indicate that consumer interest in the Wegman’s mix is lower than for the national brand?arrow_forwardA researcher designs a study that assesses the extent of alcohol abuse among college students. A large public university campus, which has an undergraduate population of approximately 10,000 students, is chosen. Advertisements for the study are placed on campus , and 58 students (36 men, 20 women) volunteer for the anonymous study. Eighty percent of the responses are from college freshmen. The students complete an anonymous questionnaire about their drinking habits, such as amount and frequency of alcohol use. Students also are asked about their grades and academic majors. These results are combined to yield general statistics about alcohol abuse among all college students. Which of the following types of bias is present in this study design? a. Bias due to confoundingb. Bias in selection of participantsc. Bias in classification of interventionsd. Bias in outcome measurementsarrow_forward
arrow_back_ios
arrow_forward_ios
Recommended textbooks for you
- MATLAB: An Introduction with ApplicationsStatisticsISBN:9781119256830Author:Amos GilatPublisher:John Wiley & Sons Inc
 Probability and Statistics for Engineering and th...StatisticsISBN:9781305251809Author:Jay L. DevorePublisher:Cengage Learning
 Statistics for The Behavioral Sciences (MindTap C...StatisticsISBN:9781305504912Author:Frederick J Gravetter, Larry B. WallnauPublisher:Cengage Learning
  Elementary Statistics: Picturing the World (7th E...StatisticsISBN:9780134683416Author:Ron Larson, Betsy FarberPublisher:PEARSON
 The Basic Practice of StatisticsStatisticsISBN:9781319042578Author:David S. Moore, William I. Notz, Michael A. FlignerPublisher:W. H. Freeman
 Introduction to the Practice of StatisticsStatisticsISBN:9781319013387Author:David S. Moore, George P. McCabe, Bruce A. CraigPublisher:W. H. Freeman
MATLAB: An Introduction with Applications
Statistics
ISBN:9781119256830
Author:Amos Gilat
Publisher:John Wiley & Sons Inc
Probability and Statistics for Engineering and th...
Statistics
ISBN:9781305251809
Author:Jay L. Devore
Publisher:Cengage Learning
Statistics for The Behavioral Sciences (MindTap C...
Statistics
ISBN:9781305504912
Author:Frederick J Gravetter, Larry B. Wallnau
Publisher:Cengage Learning
Elementary Statistics: Picturing the World (7th E...
Statistics
ISBN:9780134683416
Author:Ron Larson, Betsy Farber
Publisher:PEARSON
The Basic Practice of Statistics
Statistics
ISBN:9781319042578
Author:David S. Moore, William I. Notz, Michael A. Fligner
Publisher:W. H. Freeman
Introduction to the Practice of Statistics
Statistics
ISBN:9781319013387
Author:David S. Moore, George P. McCabe, Bruce A. Craig
Publisher:W. H. Freeman