A state's park system statistical report for the 2014/2015 fiscal year gave the accompanying data on x-amount of money collected in user fees (in thousands of dollars) and y operating cost (in thousands of dollars) for nine state parks in a certain district. User Fees Operating Costs (thousands of dollars) (thousands of dollars) 17 4000 3000 811 2000 380 33 1000. 427 (a) Construct a scatterplot of these data. 500 734 760 LAUSE SALT 4000 3000 DULE. 2000 1000 800 3,618 1,363 239 200 752 1,054 2,227 1,636 400 600 800 Describe any interesting features of the scatterplot There is a positive 4000 3000 2000 1000 200 400 600 linear relationship between user fees collected and operating costs. (b) Find the equation of the least squares line. (Round your answers to four decimal places.) 9- 1x +(1 x x (c) Is the slope of the least squares line positive or negative? Is this consistent with your description of the scatterplot in part (a)? The slope is negative, which is consistent with the description in part (a). O The slope is positive, which is not consistent with the description in part (a). O The slope is negative, which is not consistent with the description in part (a). The slope is positive, which is consistent with the description in part (a). 200 400 (4) Based on the scatterplot, do you think that the value of the correlation coefficient for this data set would be less than 0.5 or greater than 0.5? Explain. The correlation coefficient would be greater than 0.5, because the relationship appears moderate or strong O The correlation coefficient would be less than 0.5, because the values are not all colinear. O The correlation coefficient would be less than 0.5, because the relationship appears weak O The correlation coefficient would be less than 0.5, because the relationship appears moderate or strong The correlation coefficient would be greater than 0.5, because the relationship appears weak. 600 800 4000 3000 2000 1000 200 400 600
A state's park system statistical report for the 2014/2015 fiscal year gave the accompanying data on x-amount of money collected in user fees (in thousands of dollars) and y operating cost (in thousands of dollars) for nine state parks in a certain district. User Fees Operating Costs (thousands of dollars) (thousands of dollars) 17 4000 3000 811 2000 380 33 1000. 427 (a) Construct a scatterplot of these data. 500 734 760 LAUSE SALT 4000 3000 DULE. 2000 1000 800 3,618 1,363 239 200 752 1,054 2,227 1,636 400 600 800 Describe any interesting features of the scatterplot There is a positive 4000 3000 2000 1000 200 400 600 linear relationship between user fees collected and operating costs. (b) Find the equation of the least squares line. (Round your answers to four decimal places.) 9- 1x +(1 x x (c) Is the slope of the least squares line positive or negative? Is this consistent with your description of the scatterplot in part (a)? The slope is negative, which is consistent with the description in part (a). O The slope is positive, which is not consistent with the description in part (a). O The slope is negative, which is not consistent with the description in part (a). The slope is positive, which is consistent with the description in part (a). 200 400 (4) Based on the scatterplot, do you think that the value of the correlation coefficient for this data set would be less than 0.5 or greater than 0.5? Explain. The correlation coefficient would be greater than 0.5, because the relationship appears moderate or strong O The correlation coefficient would be less than 0.5, because the values are not all colinear. O The correlation coefficient would be less than 0.5, because the relationship appears weak O The correlation coefficient would be less than 0.5, because the relationship appears moderate or strong The correlation coefficient would be greater than 0.5, because the relationship appears weak. 600 800 4000 3000 2000 1000 200 400 600

Functions and Change: A Modeling Approach to College Algebra (MindTap Course List)
6th Edition
ISBN:9781337111348
Author:Bruce Crauder, Benny Evans, Alan Noell
Publisher:Bruce Crauder, Benny Evans, Alan Noell
Chapter5: A Survey Of Other Common Functions
Section5.3: Modeling Data With Power Functions
Problem 6E: Urban Travel Times Population of cities and driving times are related, as shown in the accompanying...

Related questions
Question
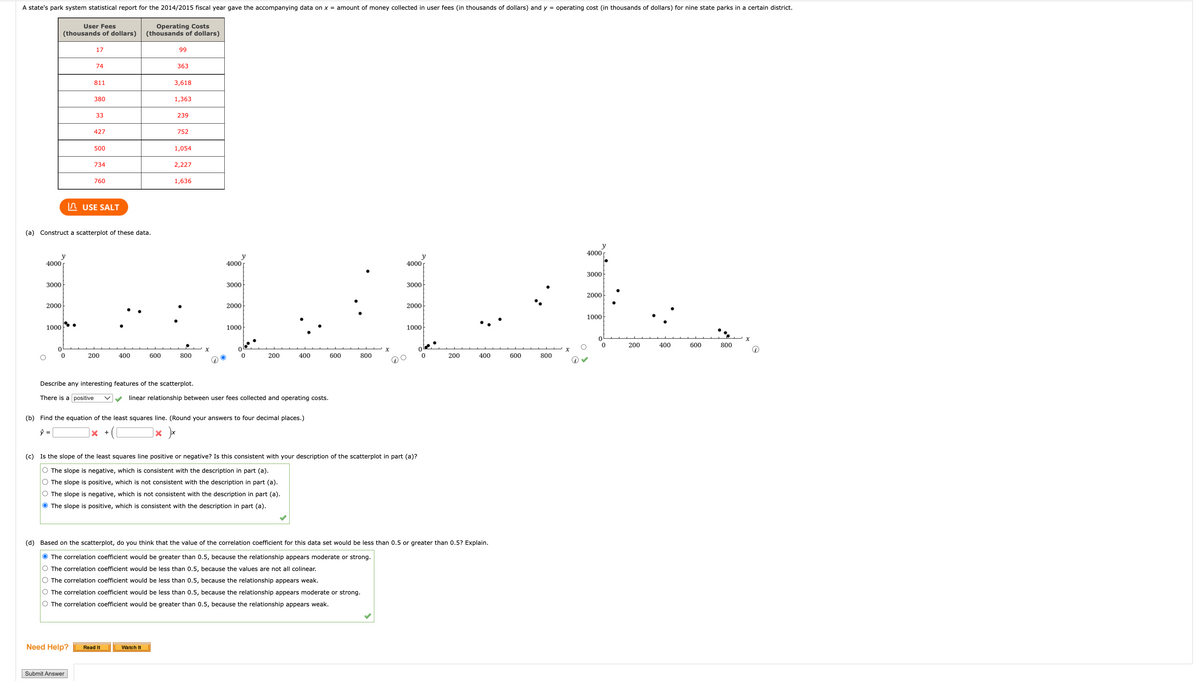
Transcribed Image Text:A state's park system statistical report for the 2014/2015 fiscal year gave the accompanying data on x = amount of money collected in user fees (in thousands of dollars) and y = operating cost (in thousands of dollars) for nine state parks in a certain district.
17
74
363
811
3,618
380
1,363
M
33
239
427
752
500
1,054
734
760
4000
(a) Construct a scatterplot of these data.
3000
User Fees
Operating Costs
(thousands of dollars) (thousands of dollars)
2000
1000
USE SALT
200
Need Help?
400
Submit Answer
600
99
Describe any interesting features of the scatterplot.
There is a positive
Read It
2,227
1,636
800
Watch It
y
4000
3000
LILL
2000
1000
0
200
400
y
4000
3000
2000
1000
0
0
(b) Find the equation of the least squares line. (Round your answers to four decimal places.)
ŷ =
X +
|× )x
200
400
linear relationship between user fees collected and operating costs.
(c) Is the slope of the least squares line positive or negative? Is this consistent with your description of the scatterplot in part (a)?
O The slope is negative, which is consistent with the description in part (a).
O The slope is positive, which is not consistent with the description in part (a).
O The slope is negative, which is not consistent with the description in part (a).
● The slope is positive, which is consistent with the description in part (a).
(d) Based on the scatterplot, do you think that the value of the correlation coefficient for this data set would be less than 0.5 or greater than 0.5? Explain.
● The correlation coefficient would be greater than 0.5, because the relationship appears moderate or strong.
O The correlation coefficient would be less than 0.5, because the values are not all colinear.
O The correlation coefficient would be less than 0.5, because the relationship appears weak.
O The correlation coefficient would be less than 0.5, because the relationship appears moderate or strong.
O The correlation coefficient would be greater than 0.5, because the relationship appears weak.
600
800
600
y
800
4000
3000
2000
1000
0
0
200
400
600
800
X
Expert Solution
This question has been solved!
Explore an expertly crafted, step-by-step solution for a thorough understanding of key concepts.

This is a popular solution!

Trending now
This is a popular solution!

Step by step
Solved in 4 steps with 2 images

Recommended textbooks for you
Functions and Change: A Modeling Approach to Coll…
Algebra
ISBN:
9781337111348
Author:
Bruce Crauder, Benny Evans, Alan Noell
Publisher:
Cengage Learning

Linear Algebra: A Modern Introduction
Algebra
ISBN:
9781285463247
Author:
David Poole
Publisher:
Cengage Learning

Algebra & Trigonometry with Analytic Geometry
Algebra
ISBN:
9781133382119
Author:
Swokowski
Publisher:
Cengage
Functions and Change: A Modeling Approach to Coll…
Algebra
ISBN:
9781337111348
Author:
Bruce Crauder, Benny Evans, Alan Noell
Publisher:
Cengage Learning
Linear Algebra: A Modern Introduction
Algebra
ISBN:
9781285463247
Author:
David Poole
Publisher:
Cengage Learning
Algebra & Trigonometry with Analytic Geometry
Algebra
ISBN:
9781133382119
Author:
Swokowski
Publisher:
Cengage


Trigonometry (MindTap Course List)
Trigonometry
ISBN:
9781337278461
Author:
Ron Larson
Publisher:
Cengage Learning

Glencoe Algebra 1, Student Edition, 9780079039897…
Algebra
ISBN:
9780079039897
Author:
Carter
Publisher:
McGraw Hill