A student was asked to find a 98% confidence interval for widget width using data from a random sample of size n = 22. Which of the following is a correct interpretation of the interval 10.2 < μ< 29.7? Check all that are correct. There is a 98% chance that the mean of a sample of 22 widgets will be between 10.2 and 29.7. With 98% confidence, the mean width of all widgets is between 10.2 and 29.7. The mean width of all widgets is between 10.2 and 29.7, 98% of the time. We know this is true because the mean of our sample is between 10.2 and 29.7. There is a 98% chance that the mean of the population is between 10.2 and 29.7. With 98% confidence, the mean width of a randomly selected widget will be between 10.2 and 29.7.
A student was asked to find a 98% confidence interval for widget width using data from a random sample of size n = 22. Which of the following is a correct interpretation of the interval 10.2 < μ< 29.7? Check all that are correct. There is a 98% chance that the mean of a sample of 22 widgets will be between 10.2 and 29.7. With 98% confidence, the mean width of all widgets is between 10.2 and 29.7. The mean width of all widgets is between 10.2 and 29.7, 98% of the time. We know this is true because the mean of our sample is between 10.2 and 29.7. There is a 98% chance that the mean of the population is between 10.2 and 29.7. With 98% confidence, the mean width of a randomly selected widget will be between 10.2 and 29.7.

Glencoe Algebra 1, Student Edition, 9780079039897, 0079039898, 2018
18th Edition
ISBN:9780079039897
Author:Carter
Publisher:Carter
Chapter10: Statistics
Section10.4: Distributions Of Data
Problem 19PFA

Related questions
Question
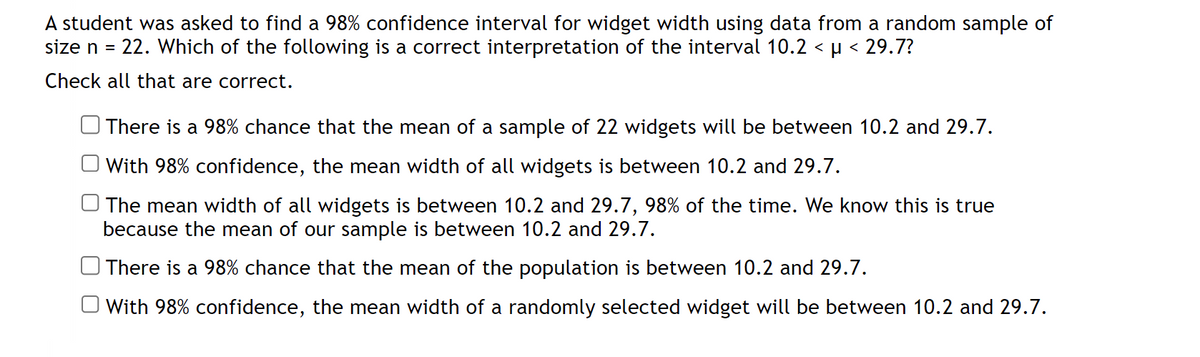
Transcribed Image Text:A student was asked to find a 98% confidence interval for widget width using data from a random sample of
size n = 22. Which of the following is a correct interpretation of the interval 10.2 < µ < 29.7?
Check all that are correct.
There is a 98% chance that the mean of a sample of 22 widgets will be between 10.2 and 29.7.
With 98% confidence, the mean width of all widgets is between 10.2 and 29.7.
The mean width of all widgets is between 10.2 and 29.7, 98% of the time. We know this is true
because the mean of our sample is between 10.2 and 29.7.
There is a 98% chance that the mean of the population is between 10.2 and 29.7.
With 98% confidence, the mean width of a randomly selected widget will be between 10.2 and 29.7.
Expert Solution
This question has been solved!
Explore an expertly crafted, step-by-step solution for a thorough understanding of key concepts.

Step by step
Solved in 2 steps

Recommended textbooks for you
Glencoe Algebra 1, Student Edition, 9780079039897…
Algebra
ISBN:
9780079039897
Author:
Carter
Publisher:
McGraw Hill
Glencoe Algebra 1, Student Edition, 9780079039897…
Algebra
ISBN:
9780079039897
Author:
Carter
Publisher:
McGraw Hill