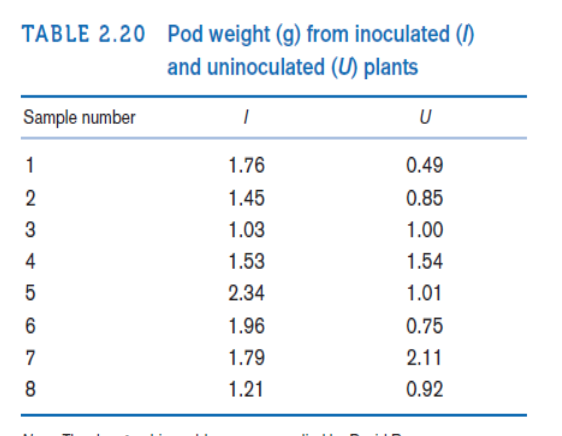
A study was conducted to demonstrate that soybeans inoculated with nitrogen-fixing bacteria yield more and grow adequately without expensive environmentally deleterious synthesized fertilizers. The trial was conducted under controlled conditions with uniform amounts of soil. The initial hypothesis was that inoculated plants would outperform their uninoculated counterparts. This assumption is based on the facts that plants need nitrogen to manufacture vital proteins and amino acids and that nitrogen-fixing bacteria would make more of this substance available to plants, increasing their size and yield. There were 8 inoculated plants (I) and 8 uninoculated plants (U). The plant yield as measured by pod weight for each plant is given in Table 2.20. Compute appropriate descriptive statistics for I and Data set available U plants.


A study was conducted to demonstrate that soybeans inoculated with nitrogen-fixing bacteria yield more and grow adequately without expensive environmentally deleterious synthesized fertilizers. The trial was conducted under controlled conditions with uniform amounts of soil. The initial hypothesis was that inoculated plants would outperform their uninoculated counterparts. This assumption is based on the facts that plants need nitrogen to manufacture vital proteins and amino acids and that nitrogen-fixing bacteria would make more of this substance available to plants, increasing their size and yield. There were 8 inoculated plants (I) and 8 uninoculated plants (U). The plant yield as measured by pod weight for each plant is given in Table 2.20.
Compute appropriate


Trending now
This is a popular solution!

Step by step
Solved in 4 steps

A study was conducted to demonstrate that soybeans inoculated with nitrogen-fixing bacteria yield more and grow adequately without expensive environmentally deleterious synthesized fertilizers. The trial was conducted under controlled conditions with uniform amounts of soil. The initial hypothesis was that inoculated plants would outperform their uninoculated counterparts. This assumption is based on the facts that plants need nitrogen to manufacture vital proteins and amino acids and that nitrogen-fixing bacteria would make more of this substance available to plants, increasing their size and yield. There were 8 inoculated plants (I) and 8 uninoculated plants (U). The plant yield as measured by pod weight for each plant is given in Table 2.20
Here are the questions I would like explanations for. Please use STATA to compute answers!!!:
2.35. The objective is to compute appropriate
2.36. Use graphic methods to compare the two groups I and U
2.37.What is your overall impression concerning the pod weight in the two groups?
