
MATLAB: An Introduction with Applications
6th Edition
ISBN: 9781119256830
Author: Amos Gilat
Publisher: John Wiley & Sons Inc
expand_more
expand_more
format_list_bulleted
Related questions
Question
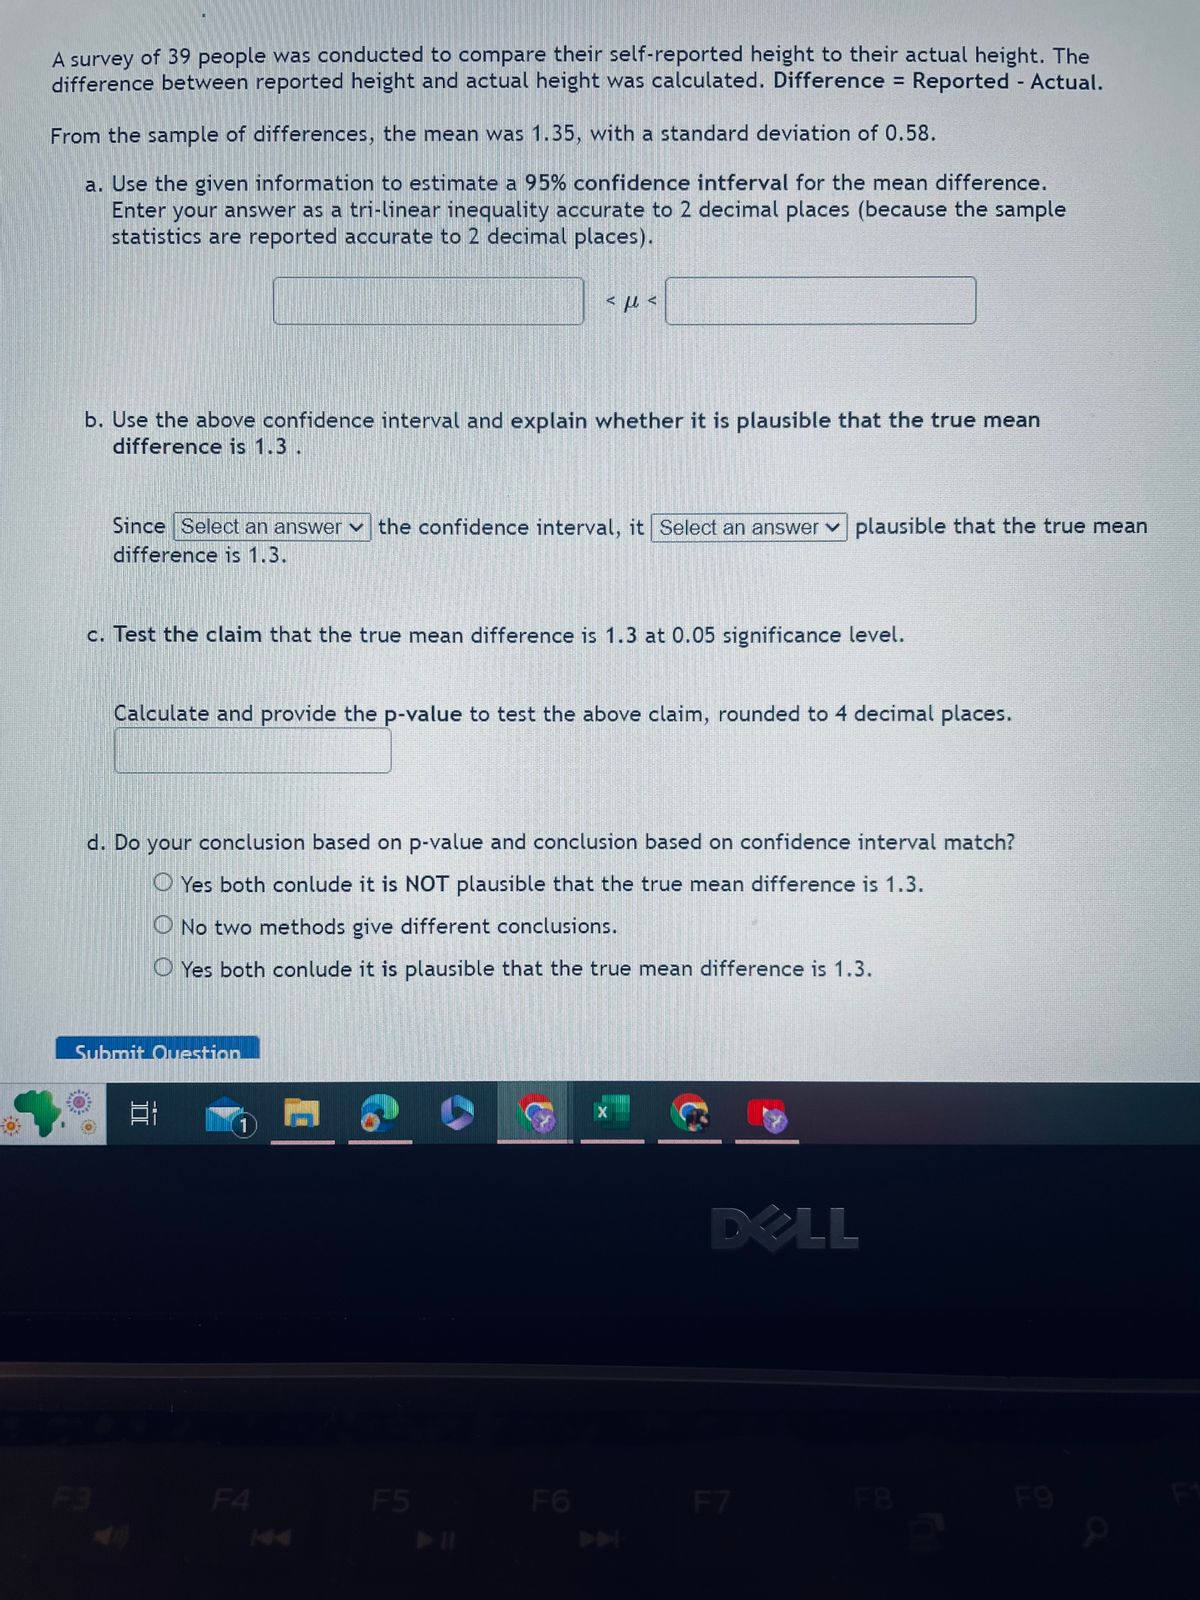

Transcribed Image Text:A survey of 39 people was conducted to compare their self-reported height to their actual height. The
difference between reported height and actual height was calculated. Difference = Reported - Actual.
From the sample of differences, the mean was 1.35, with a standard deviation of 0.58.
a. Use the given information to estimate a 95% confidence intferval for the mean difference.
Enter your answer as a tri-linear inequality accurate to 2 decimal places (because the sample
statistics are reported accurate to 2 decimal places).
b. Use the above confidence interval and explain whether it is plausible that the true mean
difference is 1.3.
Since Select an answer the confidence interval, it Select an answer plausible that the true mean
difference is 1.3.
c. Test the claim that the true mean difference is 1.3 at 0.05 significance level.
F3
Calculate and provide the p-value to test the above claim, rounded to 4 decimal places.
d. Do your conclusion based on p-value and conclusion based on confidence interval match?
Yes both conlude it is NOT plausible that the true mean difference is 1.3.
O No two methods give different conclusions.
Yes both conlude it is plausible that the true mean difference is 1.3.
Submit Question
EI
εμε
11
F4
D
F5
F6
X
DELL
F7
F9
P
Expert Solution
This question has been solved!
Explore an expertly crafted, step-by-step solution for a thorough understanding of key concepts.

This is a popular solution
Step 1: Obtain the 95% confidence interval for the mean difference.
VIEW Step 2: calculate the CI
VIEW Step 3: Determine whether it is plausible or not that the true mean difference is 1.3.
VIEW Step 4: State the hypotheses.
VIEW Step 5: Obtain the value of the test statistic.
VIEW Step 6: Obtain the P-value and determine the conclusion.
VIEW Solution
VIEW 
Trending nowThis is a popular solution!

Step by stepSolved in 7 steps with 8 images

Knowledge Booster

Similar questions
- The mean score on a driving exam for a group of drivers education students is 72 points with a standard deviation of 6 points. apply Chebyshev theorem to the data using K=2. Interpret the results. Simplify answer.arrow_forwardsuppose that a category of world-class runners are known to run a marathon (26 miles) in an average of 143 minutes with a standard deviation of 14 minutes. consider 49 of the races. Let x̅ = the average of the 49 races. I need help finding the median of the average running times. if someone could explain how to solve this problem that would be greatarrow_forwardA study group takes a practice statistics exam. They find that the group has a mean score of 80 with a Standard Deviation of 5. Lily has a z-score of 1.9 and wants to know her raw score. Calculate her score. the answer is Between 89.4 and 89.6 can you please show me the work, how do I find her score?arrow_forward
arrow_back_ios
arrow_forward_ios
Recommended textbooks for you
- MATLAB: An Introduction with ApplicationsStatisticsISBN:9781119256830Author:Amos GilatPublisher:John Wiley & Sons Inc
 Probability and Statistics for Engineering and th...StatisticsISBN:9781305251809Author:Jay L. DevorePublisher:Cengage Learning
 Statistics for The Behavioral Sciences (MindTap C...StatisticsISBN:9781305504912Author:Frederick J Gravetter, Larry B. WallnauPublisher:Cengage Learning
  Elementary Statistics: Picturing the World (7th E...StatisticsISBN:9780134683416Author:Ron Larson, Betsy FarberPublisher:PEARSON
 The Basic Practice of StatisticsStatisticsISBN:9781319042578Author:David S. Moore, William I. Notz, Michael A. FlignerPublisher:W. H. Freeman
 Introduction to the Practice of StatisticsStatisticsISBN:9781319013387Author:David S. Moore, George P. McCabe, Bruce A. CraigPublisher:W. H. Freeman
MATLAB: An Introduction with Applications
Statistics
ISBN:9781119256830
Author:Amos Gilat
Publisher:John Wiley & Sons Inc
Probability and Statistics for Engineering and th...
Statistics
ISBN:9781305251809
Author:Jay L. Devore
Publisher:Cengage Learning
Statistics for The Behavioral Sciences (MindTap C...
Statistics
ISBN:9781305504912
Author:Frederick J Gravetter, Larry B. Wallnau
Publisher:Cengage Learning
Elementary Statistics: Picturing the World (7th E...
Statistics
ISBN:9780134683416
Author:Ron Larson, Betsy Farber
Publisher:PEARSON
The Basic Practice of Statistics
Statistics
ISBN:9781319042578
Author:David S. Moore, William I. Notz, Michael A. Fligner
Publisher:W. H. Freeman
Introduction to the Practice of Statistics
Statistics
ISBN:9781319013387
Author:David S. Moore, George P. McCabe, Bruce A. Craig
Publisher:W. H. Freeman