a. Calculate the distribution of answers to Q5 [Were both of your parents born in the US?], showing both counts and percentages. Discuss this distribution. b. Calculate the distribution of answers to Q12 [What is the size of the town/city in which you spent most of your childhood?], showing both counts and percentages. Discuss this distribution. c. You will now study the relationship between these two categorical variables. You will treat Q5 as the explanatory variable and Q12 as the response variable. Discuss in plain language what kind of relationship you expect between these two variables. d. Now calculate a two-way table of these two variables. Put Q5 at the top of table, with categories spread horizontally, and Q12 at the left of table, with categories spread vertically. Show counts as well as column percentages. Verify that the marginal distributions of this two-way table correspond to your answers to part A and B E. Draw a side-by-side bar graph showing how individuals are distributed by town size (in percentages), for individuals with both parents born in the US vs. individuals with at least one parent born abroad. These are the column percentages you calculated in part d.
a. Calculate the distribution of answers to Q5 [Were both of your parents born in the US?], showing both counts and percentages. Discuss this distribution. b. Calculate the distribution of answers to Q12 [What is the size of the town/city in which you spent most of your childhood?], showing both counts and percentages. Discuss this distribution. c. You will now study the relationship between these two categorical variables. You will treat Q5 as the explanatory variable and Q12 as the response variable. Discuss in plain language what kind of relationship you expect between these two variables. d. Now calculate a two-way table of these two variables. Put Q5 at the top of table, with categories spread horizontally, and Q12 at the left of table, with categories spread vertically. Show counts as well as column percentages. Verify that the marginal distributions of this two-way table correspond to your answers to part A and B E. Draw a side-by-side bar graph showing how individuals are distributed by town size (in percentages), for individuals with both parents born in the US vs. individuals with at least one parent born abroad. These are the column percentages you calculated in part d.

Glencoe Algebra 1, Student Edition, 9780079039897, 0079039898, 2018
18th Edition
ISBN:9780079039897
Author:Carter
Publisher:Carter
Chapter10: Statistics
Section10.4: Distributions Of Data
Problem 19PFA

Related questions
Question
![a. Calculate the distribution of answers to Q5 [Were both
of your parents born in the US?], showing both counts.
and percentages. Discuss this distribution.
b. Calculate the distribution of answers to Q12 [What is
the size of the town/city in which you spent most of your
childhood?], showing both counts and percentages.
Discuss this distribution.
c. You will now study the relationship between these two
categorical variables. You will treat Q5 as the explanatory
variable and Q12 as the response variable. Discuss in
plain language what kind of relationship you expect
between these two variables.
d. Now calculate a two-way table of these two variables.
Put Q5 at the top of table, with categories spread
horizontally, and Q12 at the left of table, with categories
spread vertically. Show counts as well as column
percentages. Verify that the marginal distributions of this
two-way table correspond to your answers to part A and
B
E. Draw a side-by-side bar graph showing how
individuals are distributed by town size (in percentages),
for individuals with both parents born in the US vs.
individuals with at least one parent born abroad. These
are the column percentages you calculated in part d.
f. Looking at the bar graph you constructed in part E,
discuss whether the observed
relationship between the two variables corresponds to
the expectation you formulated in part c.](/v2/_next/image?url=https%3A%2F%2Fcontent.bartleby.com%2Fqna-images%2Fquestion%2F96ce4e79-a9b7-4338-8d9e-1cd0f12f5b89%2F2a3a418c-7286-4e29-b8b4-dd2ca00a73d7%2Fas1qcft_processed.jpeg&w=3840&q=75)
Transcribed Image Text:a. Calculate the distribution of answers to Q5 [Were both
of your parents born in the US?], showing both counts.
and percentages. Discuss this distribution.
b. Calculate the distribution of answers to Q12 [What is
the size of the town/city in which you spent most of your
childhood?], showing both counts and percentages.
Discuss this distribution.
c. You will now study the relationship between these two
categorical variables. You will treat Q5 as the explanatory
variable and Q12 as the response variable. Discuss in
plain language what kind of relationship you expect
between these two variables.
d. Now calculate a two-way table of these two variables.
Put Q5 at the top of table, with categories spread
horizontally, and Q12 at the left of table, with categories
spread vertically. Show counts as well as column
percentages. Verify that the marginal distributions of this
two-way table correspond to your answers to part A and
B
E. Draw a side-by-side bar graph showing how
individuals are distributed by town size (in percentages),
for individuals with both parents born in the US vs.
individuals with at least one parent born abroad. These
are the column percentages you calculated in part d.
f. Looking at the bar graph you constructed in part E,
discuss whether the observed
relationship between the two variables corresponds to
the expectation you formulated in part c.
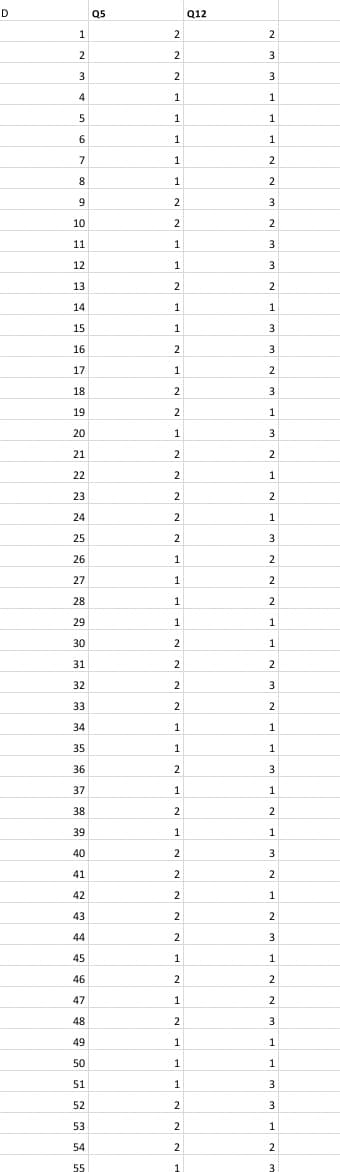
Transcribed Image Text:D
1
2
3
4
5
6
7
8
9
10
11
12
13
14
15
16
17
18
19
20
21
22
23
24
25
26
27
28
29
30
31
32
33
34
35
36
37
38
39
40
41
42
43
44
45
46
47
48
49
50
51
52
53
54
55
Q5
2
2
2
1
1
1
1
1
2
2
1
1
2
1
1
2
1
2
2
1
2
2
2
2
2
1
1
1
1
2
2
2
2
1
1
2
1
2
1
2
2
2
2
2
1
2
1
2
1
1
1
2
2
2
1
Q12
2
3
3
1
1
1
2
2
3
2
3
3
2
1
3
3
2
3
1
3
2
1
2
1
3
2
2
2
1
1
2
3
2
1
1
3
1
2
1
3
2
1
2
3
1
2
2
3
1
1
3
3
1
2
3
Expert Solution
This question has been solved!
Explore an expertly crafted, step-by-step solution for a thorough understanding of key concepts.

Step by step
Solved in 4 steps with 1 images

Recommended textbooks for you
Glencoe Algebra 1, Student Edition, 9780079039897…
Algebra
ISBN:
9780079039897
Author:
Carter
Publisher:
McGraw Hill
Glencoe Algebra 1, Student Edition, 9780079039897…
Algebra
ISBN:
9780079039897
Author:
Carter
Publisher:
McGraw Hill