accompanying data on average anterior maximum inclination angle (AMIA) both in the clockwise direction and in the counterclockwise direction. Subj: 6 7 8 Clockwise (CI): 1 2 3 4 5 9 10 11 12 13 14 57.9 35.7 53.5 55.8 51.1 70.8 77.3 51.6 54.7 63.6 59.2 59.2 55.8 38.5 44.2 52.1 60.2 51.7 47.2 65.6 71.4 48.8 53.1 66.3 Counterclockwise (Co): 59.8 47.5 64.5 34.5 (a) Calculate a point estimate of the population correlation coefficient between CI AMIA and Co AMIA (Σε CI = 784.7, Co = 766.9, C1² = 45,506.71, Co² = 43,373.67, CICO = 44,019.17. Round your answer to three decimal places.) (b) Assuming bivariate normality (normal probability plots of the Cl and Co samples are reasonably straight), carry out a test at significance level 0.01 to decide whether there is a linear association between the two variables in the population (as do the authors of the cited paper). State the appropriate null and alternative hypotheses. OH₂: P = 0 H₂: P<0 OH₁: P = 0 H₂: p > 0 O Ho: P = 0 H₂: P = 0 ⒸH₁: P = 0 H₂: p=0 Calculate the test statistic and determine the P-value. (Round your test statistic to two decimal places and your P-value to three decimal places.) t = P-value =
accompanying data on average anterior maximum inclination angle (AMIA) both in the clockwise direction and in the counterclockwise direction. Subj: 6 7 8 Clockwise (CI): 1 2 3 4 5 9 10 11 12 13 14 57.9 35.7 53.5 55.8 51.1 70.8 77.3 51.6 54.7 63.6 59.2 59.2 55.8 38.5 44.2 52.1 60.2 51.7 47.2 65.6 71.4 48.8 53.1 66.3 Counterclockwise (Co): 59.8 47.5 64.5 34.5 (a) Calculate a point estimate of the population correlation coefficient between CI AMIA and Co AMIA (Σε CI = 784.7, Co = 766.9, C1² = 45,506.71, Co² = 43,373.67, CICO = 44,019.17. Round your answer to three decimal places.) (b) Assuming bivariate normality (normal probability plots of the Cl and Co samples are reasonably straight), carry out a test at significance level 0.01 to decide whether there is a linear association between the two variables in the population (as do the authors of the cited paper). State the appropriate null and alternative hypotheses. OH₂: P = 0 H₂: P<0 OH₁: P = 0 H₂: p > 0 O Ho: P = 0 H₂: P = 0 ⒸH₁: P = 0 H₂: p=0 Calculate the test statistic and determine the P-value. (Round your test statistic to two decimal places and your P-value to three decimal places.) t = P-value =

MATLAB: An Introduction with Applications
6th Edition
ISBN:9781119256830
Author:Amos Gilat
Publisher:Amos Gilat
Chapter1: Starting With Matlab
Section: Chapter Questions
Problem 1P

Related questions
Question
Q12
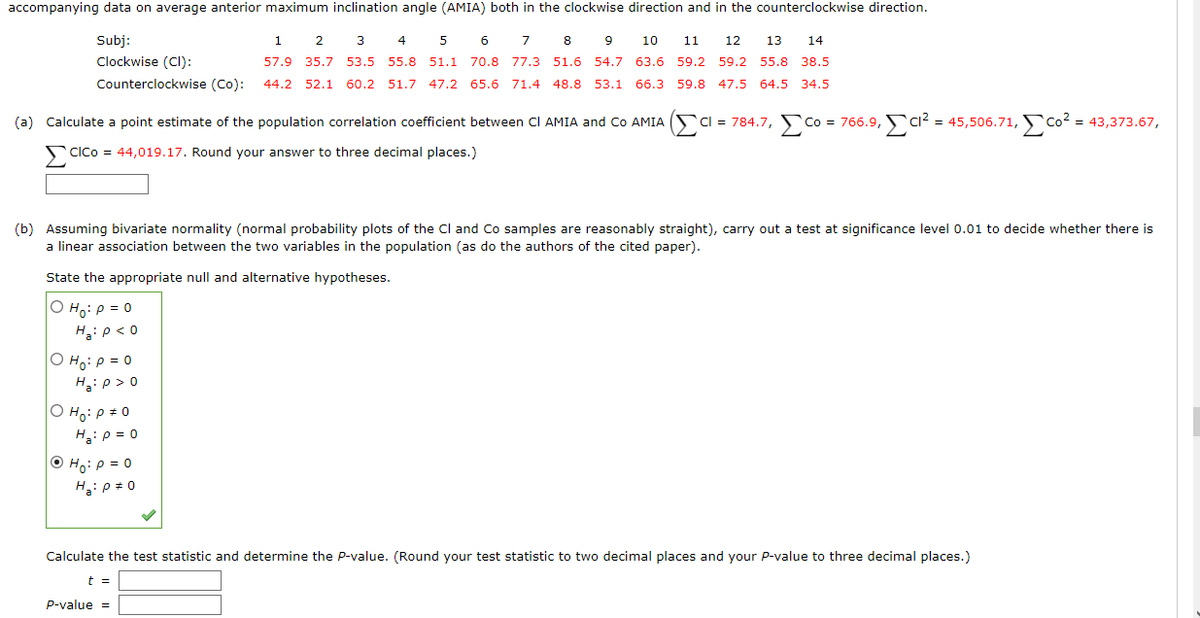
Transcribed Image Text:accompanying data on average anterior maximum inclination angle (AMIA) both in the clockwise direction and in the counterclockwise direction.
Subj:
5
6
7
8
1 2 3 4
9 10 11 12 13 14
57.9 35.7 53.5 55.8 51.1 70.8 77.3 51.6 54.7 63.6 59.2 59.2 55.8 38.5
Clockwise (CI):
Counterclockwise (Co):
44.2 52.1 60.2 51.7 47.2 65.6 71.4 48.8 53.1 66.3 59.8 47.5 64.5 34.5
(a) Calculate a point estimate of the population correlation coefficient between CI AMIA and Co AMIACI = 784.7, Co = 766.9, C1² = 45,506.71,Co² = 43,373.67,
CICO = 44,019.17. Round your answer to three decimal places.)
(b) Assuming bivariate normality (normal probability plots of the Cl and Co samples are reasonably straight), carry out a test at significance level 0.01 to decide whether there is
a linear association between the two variables in the population (as do the authors of the cited paper).
State the appropriate null and alternative hypotheses.
O Ho: P = 0
Ha: P < 0
OH₂: P = 0
Ha: P >0
O Ho: P = 0
H₂: P = 0
ⒸH₂: P = 0
H₂: P = 0
Calculate the test statistic and determine the P-value. (Round your test statistic to two decimal places and your P-value to three decimal places.)
t =
P-value =
Expert Solution
This question has been solved!
Explore an expertly crafted, step-by-step solution for a thorough understanding of key concepts.

This is a popular solution!

Trending now
This is a popular solution!

Step by step
Solved in 3 steps

Recommended textbooks for you
MATLAB: An Introduction with Applications
Statistics
ISBN:
9781119256830
Author:
Amos Gilat
Publisher:
John Wiley & Sons Inc

Probability and Statistics for Engineering and th…
Statistics
ISBN:
9781305251809
Author:
Jay L. Devore
Publisher:
Cengage Learning

Statistics for The Behavioral Sciences (MindTap C…
Statistics
ISBN:
9781305504912
Author:
Frederick J Gravetter, Larry B. Wallnau
Publisher:
Cengage Learning
MATLAB: An Introduction with Applications
Statistics
ISBN:
9781119256830
Author:
Amos Gilat
Publisher:
John Wiley & Sons Inc
Probability and Statistics for Engineering and th…
Statistics
ISBN:
9781305251809
Author:
Jay L. Devore
Publisher:
Cengage Learning
Statistics for The Behavioral Sciences (MindTap C…
Statistics
ISBN:
9781305504912
Author:
Frederick J Gravetter, Larry B. Wallnau
Publisher:
Cengage Learning

Elementary Statistics: Picturing the World (7th E…
Statistics
ISBN:
9780134683416
Author:
Ron Larson, Betsy Farber
Publisher:
PEARSON

The Basic Practice of Statistics
Statistics
ISBN:
9781319042578
Author:
David S. Moore, William I. Notz, Michael A. Fligner
Publisher:
W. H. Freeman

Introduction to the Practice of Statistics
Statistics
ISBN:
9781319013387
Author:
David S. Moore, George P. McCabe, Bruce A. Craig
Publisher:
W. H. Freeman